


Role
UX/UI Designer
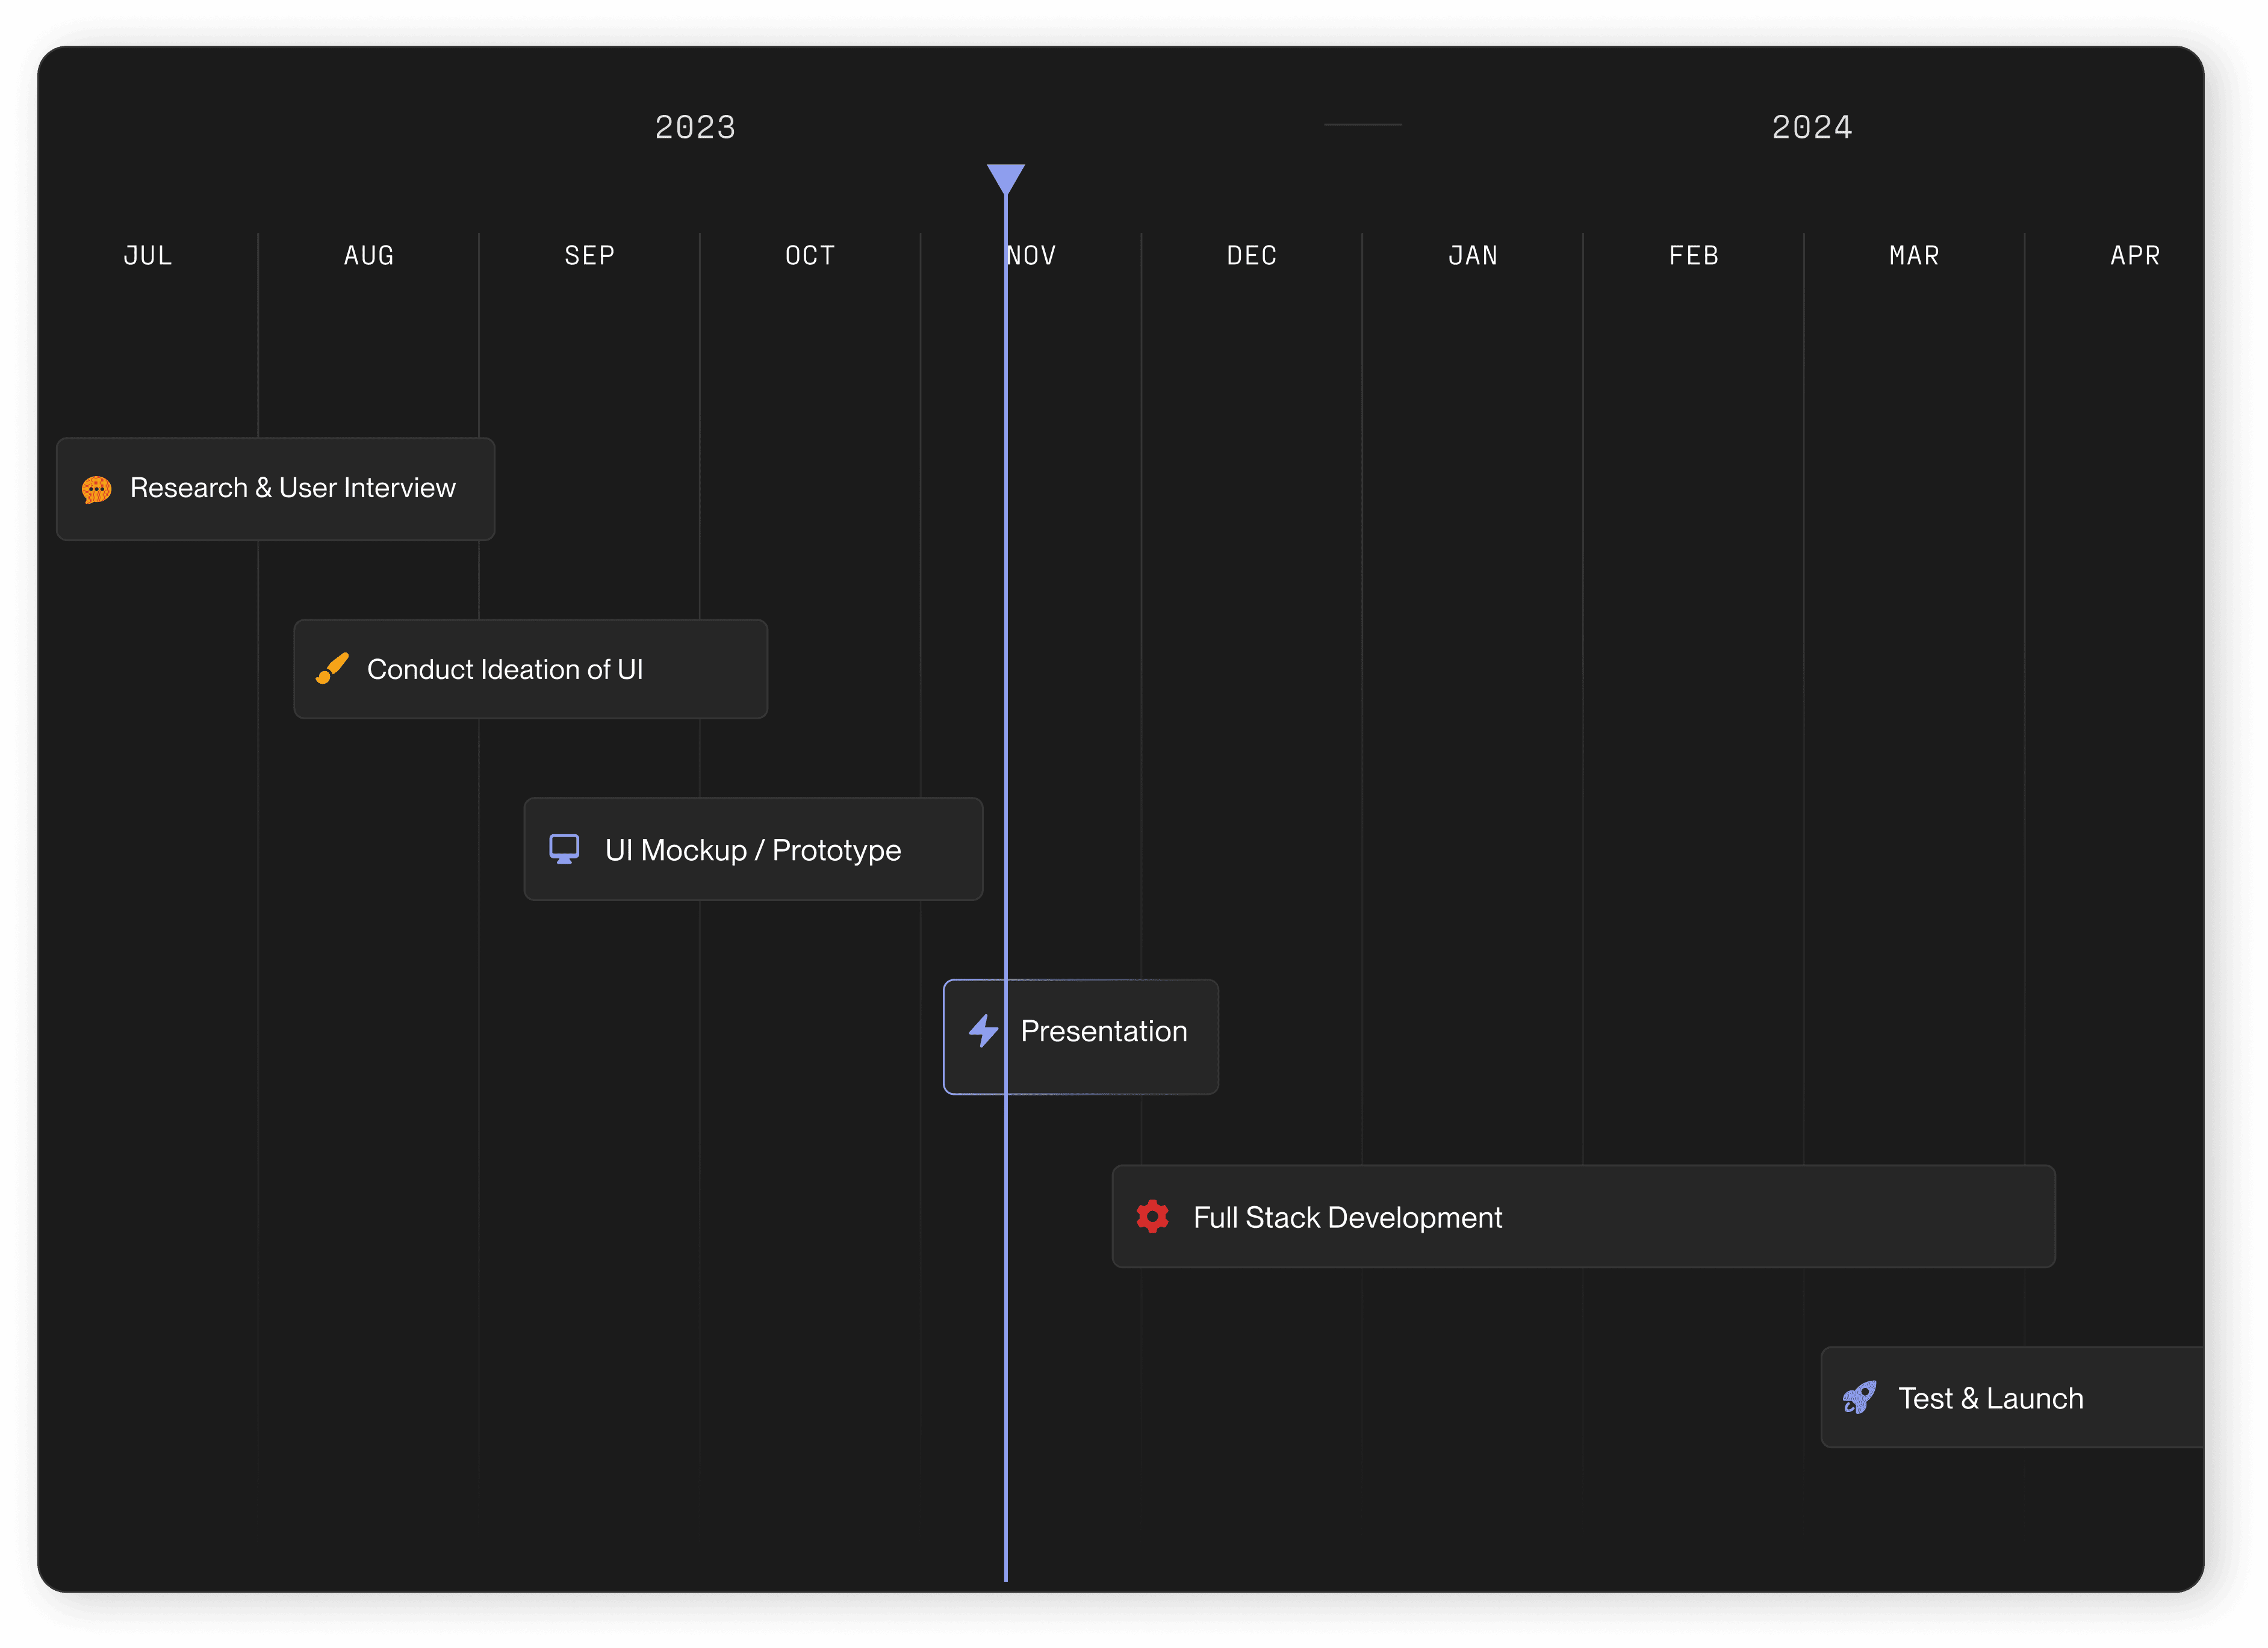
Timeframe
June 2023 - Dec 2023
Team
2 Designers
Overview
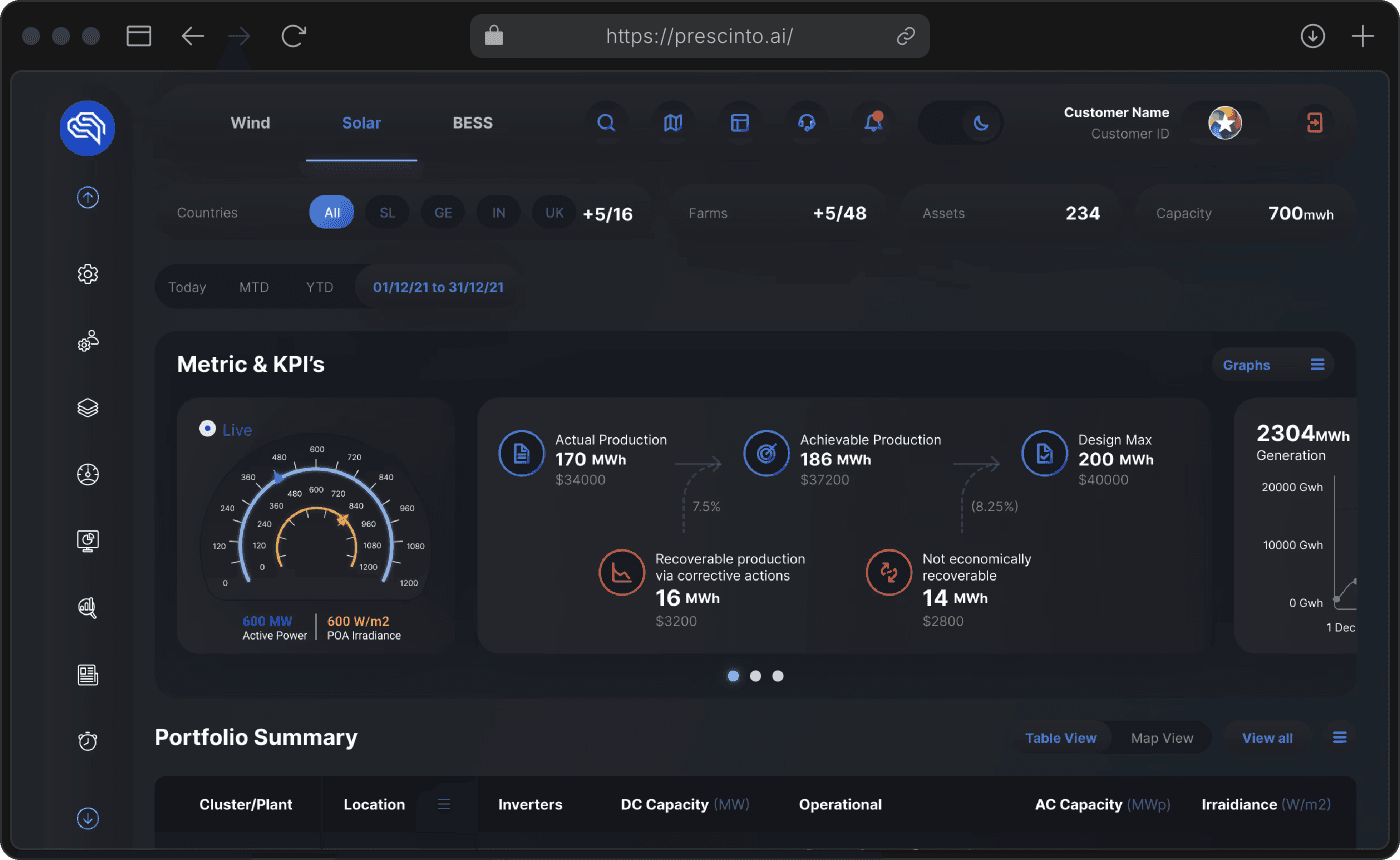
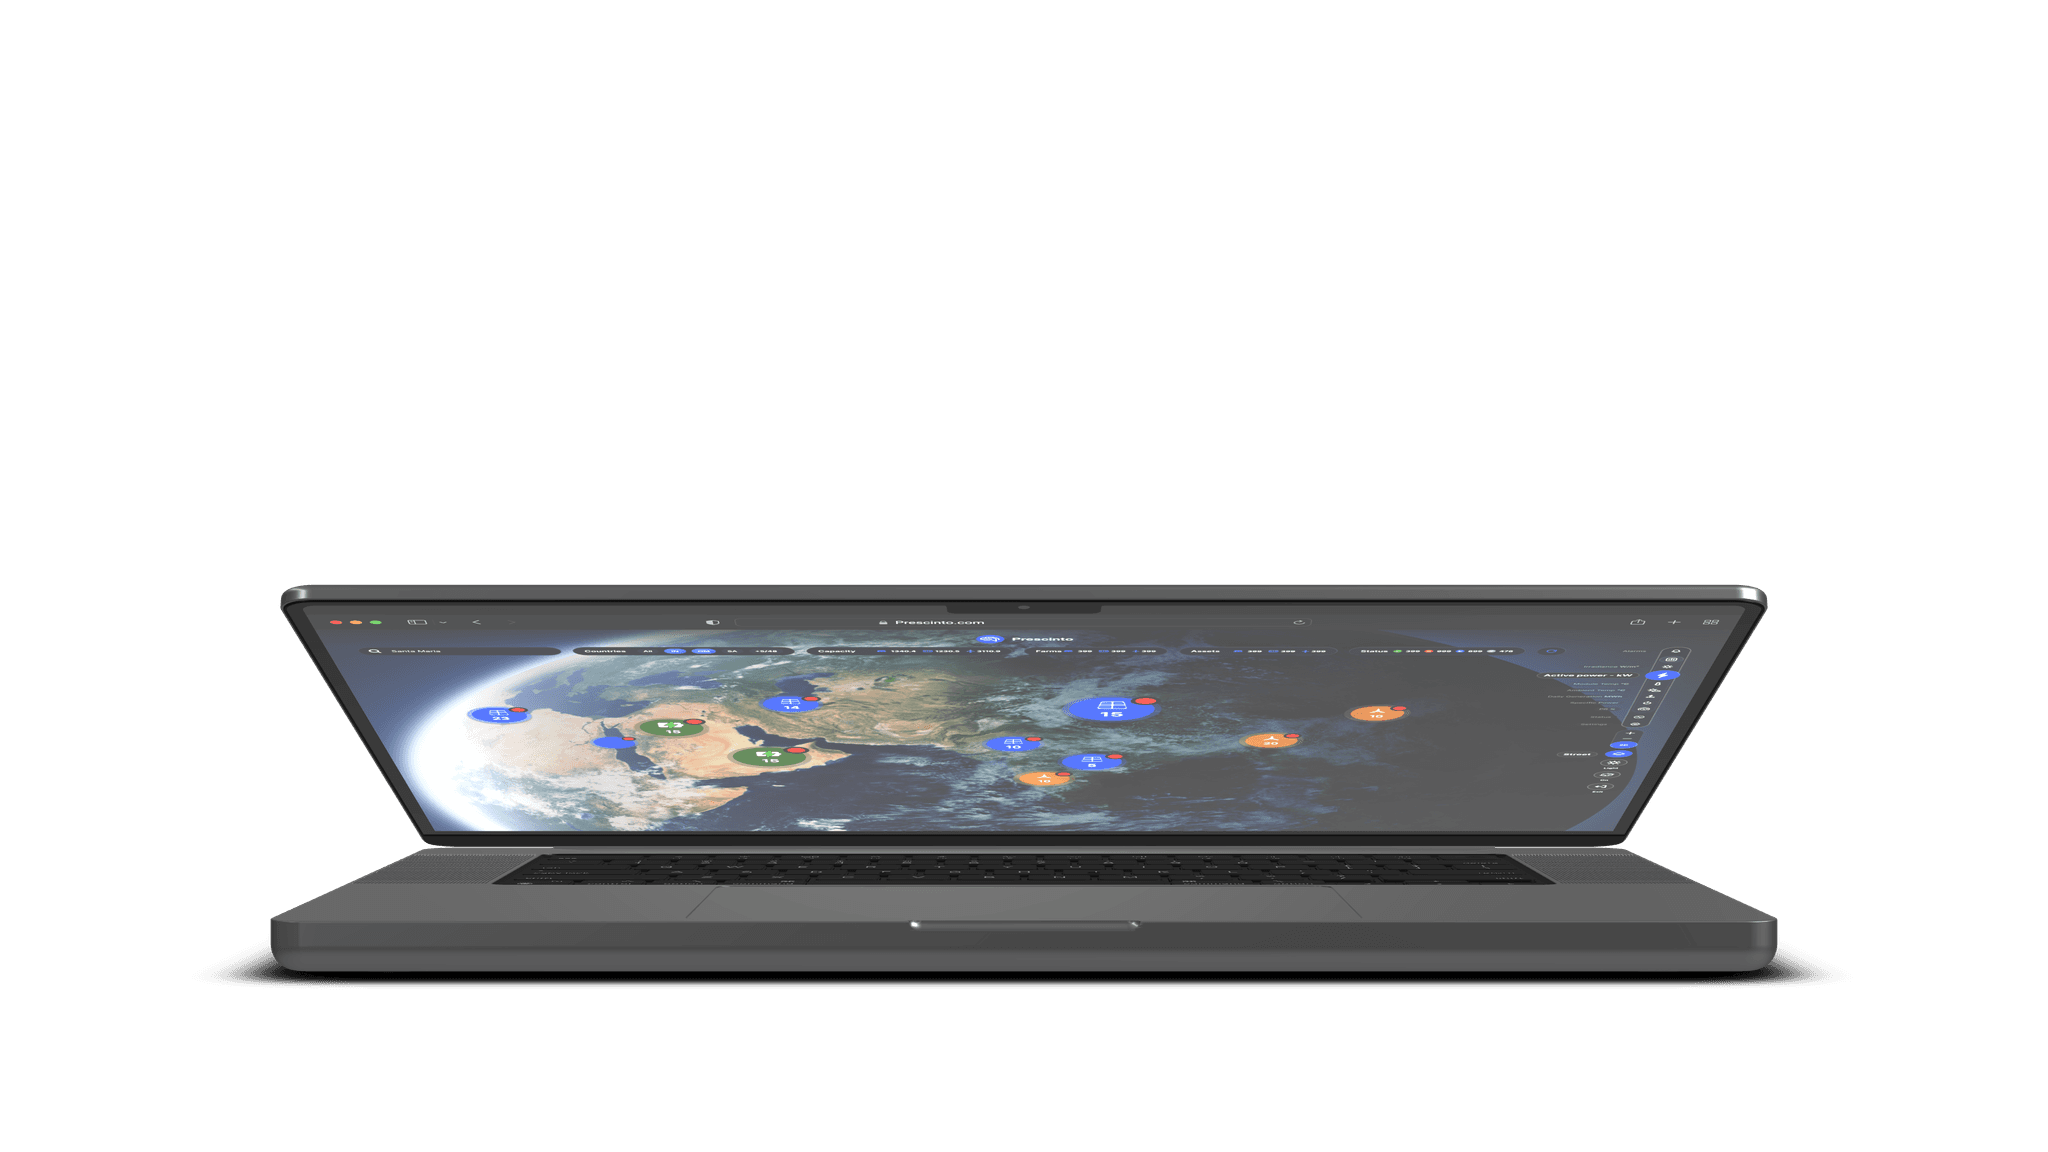
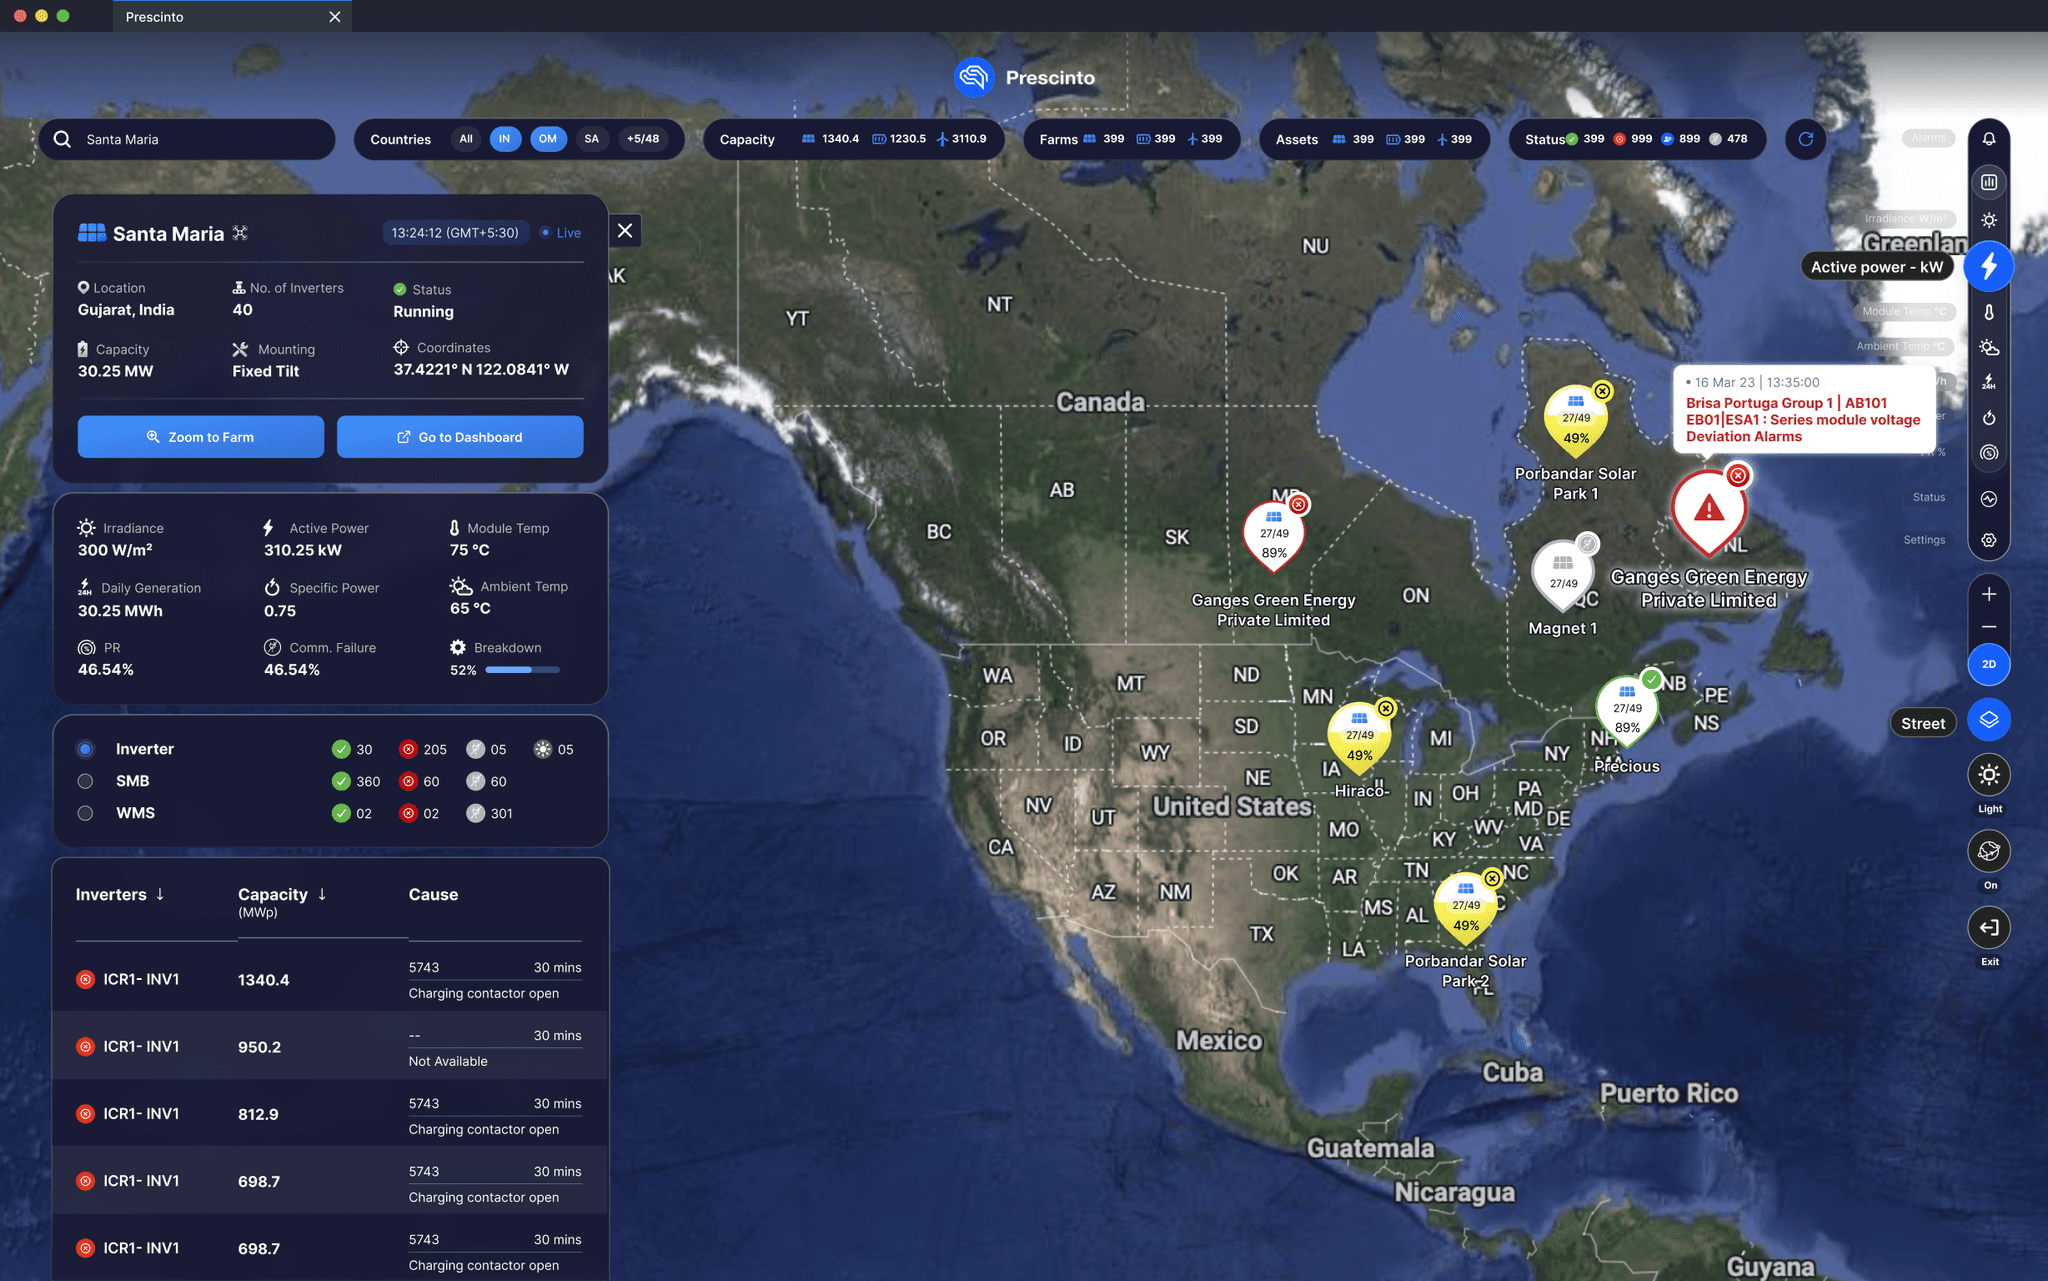
As the main UI/UX Designer, I spearheaded the redesign of Prescinto's Map View feature, transforming it into Map View 2.0, a powerful tool that enables renewable energy companies to manage their asset portfolios more efficiently.
My goal was to address the platform’s usability issues, improve data visualisation, and create an intuitive, interactive experience for asset managers.
Table of Contents
Highlight
01
Context
02
Research V1
03
Iteration V1
04
Research V2
05
Final Designs
06
Closer
02 Context ⬎
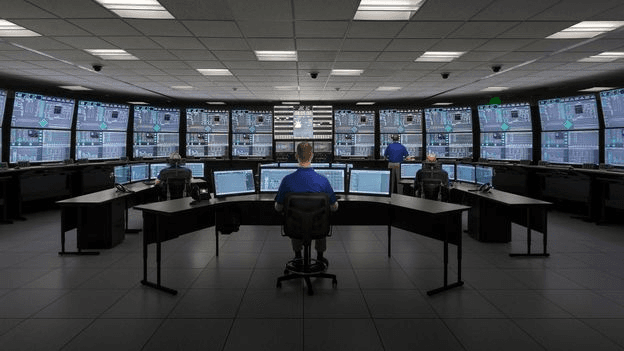
With the growing adoption of renewable energy technologies, asset owners and managers face increasing challenges in optimizing performance across diverse portfolios. As the industry evolves, it's crucial that decision-makers are equipped with real-time insights and advanced tools to enhance operational efficiency and ensure sustainable growth in the clean energy sector.
What is our challenge?
How might we design an intuitive, interactive platform that enables renewable energy asset managers to seamlessly monitor, analyze, and optimize diverse portfolios across multiple geographic locations, ensuring real-time insights and more efficient decision-making?
Impact & Responsibilities
Delivered final UI/UX designs, now in development, enhancing asset management efficiency.
Conduct formal interview with Renewable energy industry experts
Collaborate with engineers to sync on design to dev requirements
Presented prototypes and final designs to stakeholders for approval.
03 RESEARCH V1 ⬎
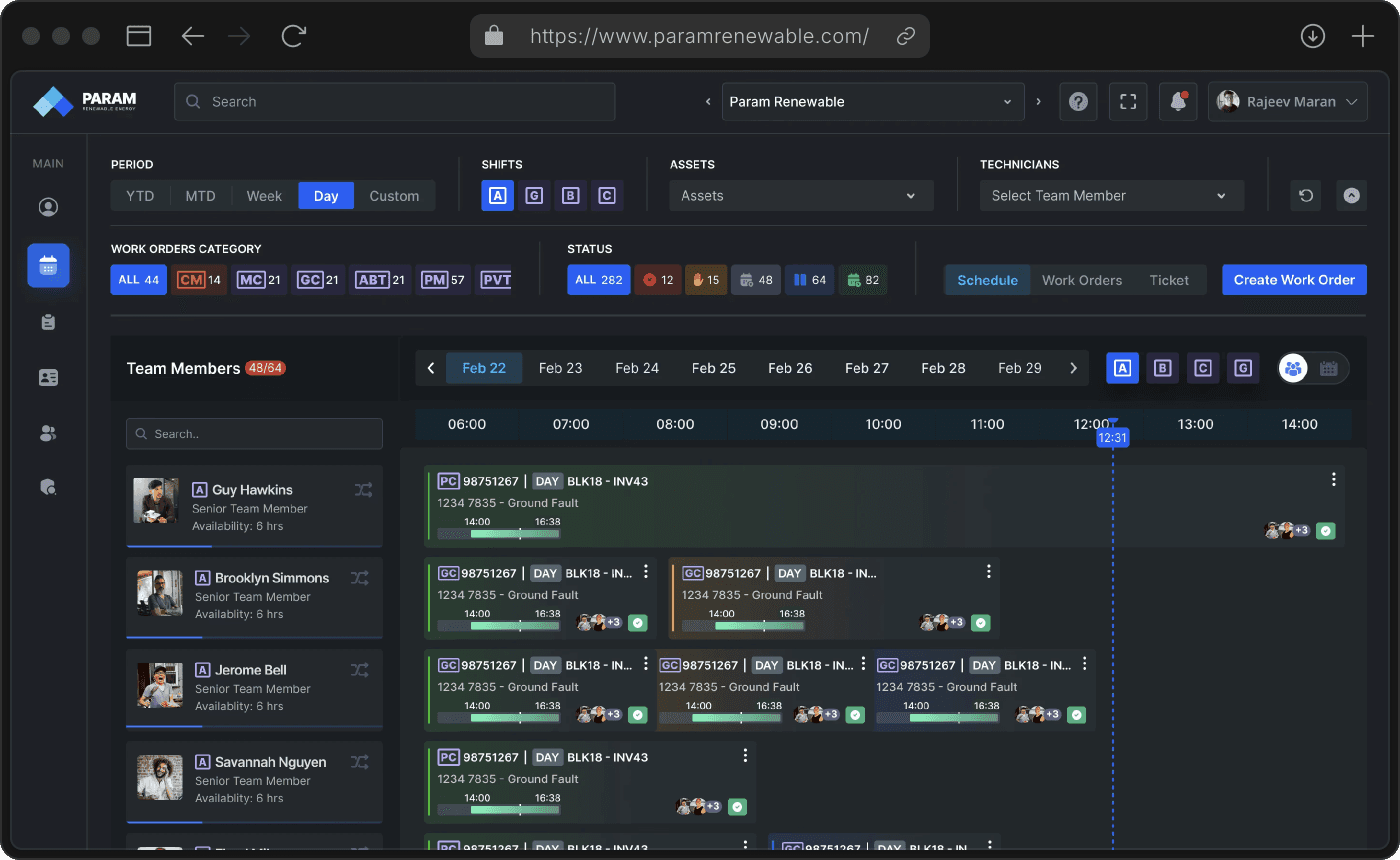
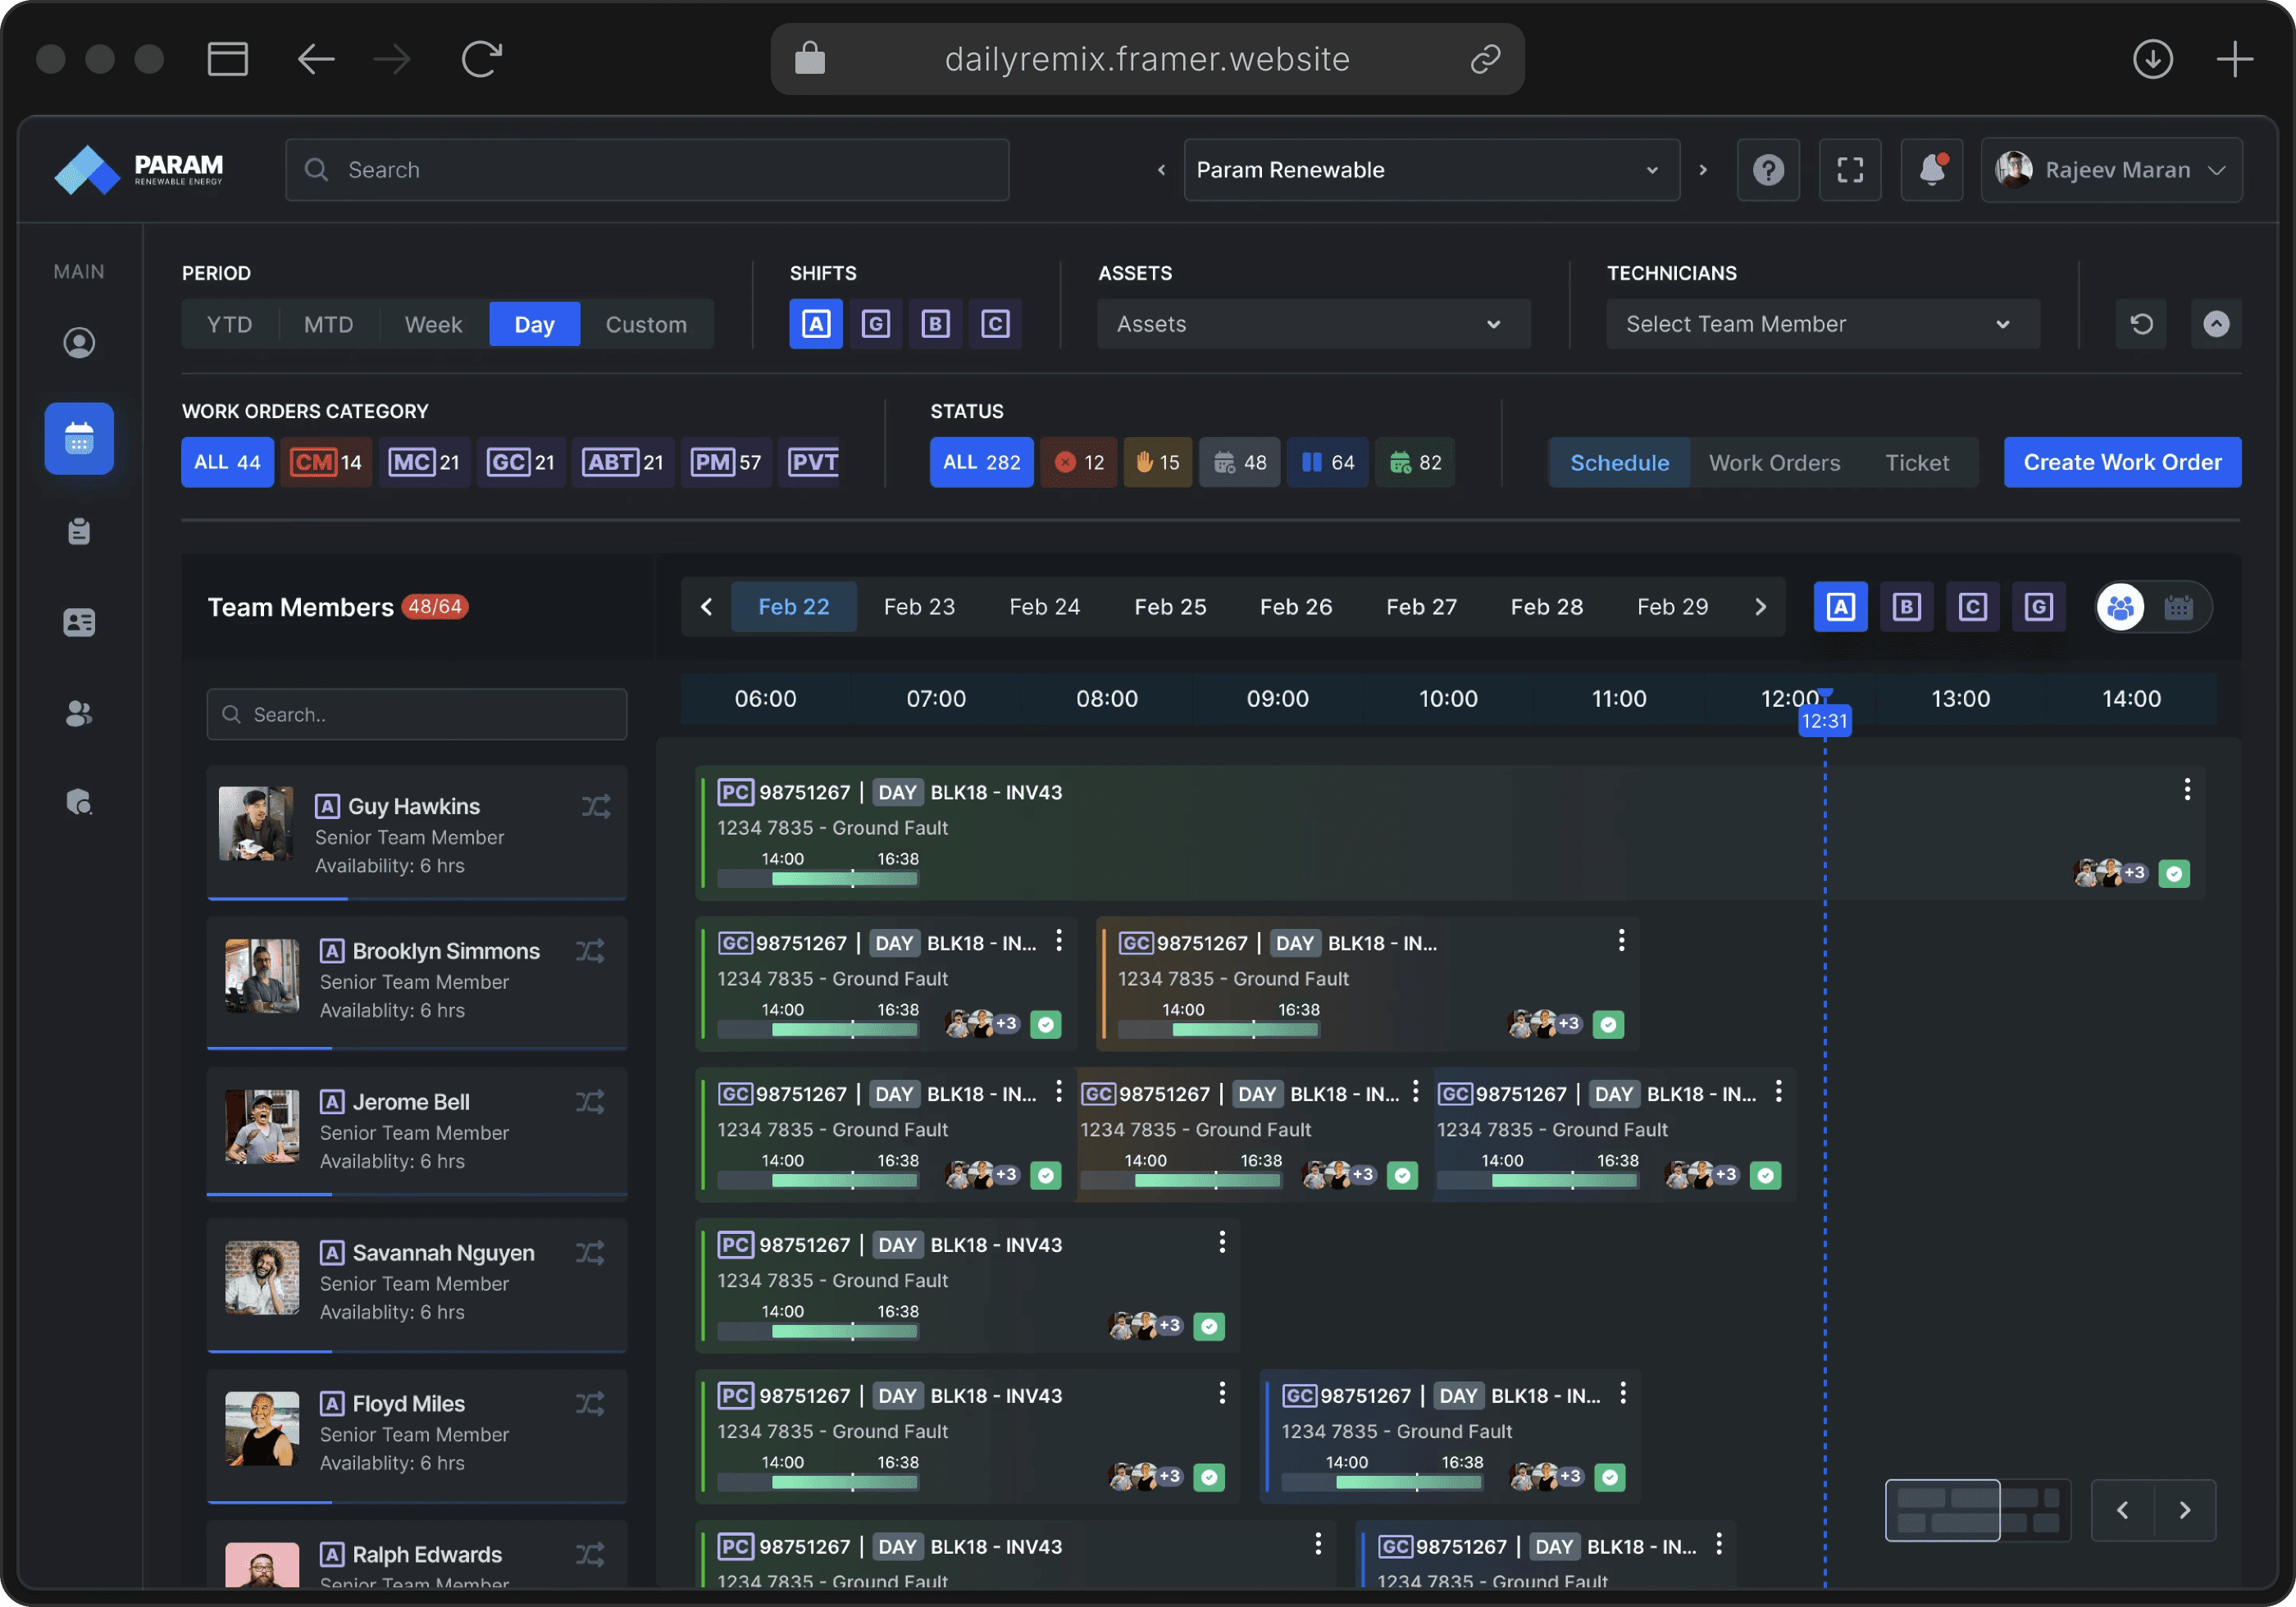
To address the complexities of renewable energy work order management, I first explored the dynamics of planned and unplanned maintenance activities. This involved researching existing O&M strategies and analyzing how automation can streamline these processes, especially as system capacities expand.
In addition, I also performed some competitive feature analysis and data research to figure out what visual tools already exist and what open-source data is available for us to use online.

Challenges Identified:
✴
Increased Complexity: Larger renewable systems bring more data and potential issues, making manual work order management inefficient.
✴
Automation Needs: Manual methods struggle to keep up with the scale and speed of data generation, emphasizing the need for AI-powered solutions.
Key Areas of Focus:
✴
Automation Tools: I researched how AI and ML can be leveraged to automate work order generation and improve resource allocation.
✴
Challenges in Automation:
Context Awareness: Ensuring work order systems account for interdependent devices.
Signal Issues: Addressing fluctuating data and false alarms.
Configuration Flexibility: Offering customizable monitoring strategies to meet specific needs.
01 Highlight ⬎
05 RESEARCH V2 ⬎
To gain a deeper understanding of the problem, I conducted extensive research, engaging with renewable energy asset managers and industry experts. The goal was to identify the key pain points they encounter while managing diverse energy portfolios and to explore opportunities for enhancing the user experience of Prescinto's Map View 2.0.
Major Questions Asked ?
Here are the key questions asked during user interviews and usability testing sessions:
✴
✴
✴
DRAG TO MOVE
“Use multiple tools and spreadsheets to monitor assets.”
Habits
“Frequently consult dashboards for quick status updates.”
Habits
“Prefer visual
representations of data
for easy comprehension.”
Habits
“Difficulty navigating through data-heavy interfaces.”
Frustrations
“Struggle to interpret data trends and predict performance issues effectively.”
Frustrations
“
"Frequent false alarms and lack of context-specific alerts, making monitoring inefficient.”
Frustrations
“Desire for a consolidated platform that combines data visualization with AI insights”
Feedbacks
“Need for an intuitive interface that allows filtering and drilling down into specific assets.”
Feedbacks
“Preference for customizable alerts and dashboards tailored to their specific assets and locations.”
Feedbacks

Actionable Insights
The interviews were very insightful as it showed us our lack of knowledge on the topic. This made us reexamine the execution of our solutions and redesign new solutions for real user needs. From our insights, we shifted gears and ideated further on our features based on some insights we garnered.
Understanding
Our User Personas
To design a platform that truly meets the needs of renewable energy professionals, it’s essential to understand who they are, what challenges they face, and what goals they aim to achieve. These user personas illustrate the key roles and pain points of our target users, guiding our design decisions to create an intuitive, efficient, and impactful user experience.
✴
✴
✴

Role: Senior Asset Operations Manager
Company: CleanEnergy Corp.
Experience: 12 years in renewable energy management
“I want to see all my assets in one place, with visual cues for performance status across locations—something that allows me to monitor them without jumping between multiple screens.”
Pointers
✴
Goal: Optimize performance and reduce downtime across renewable energy sites
✴
Frustration: Managing multiple data sources without a unified view.
✴
Need: Centralized dashboard with AI-driven insights for proactive management.
Our actionable solutions address the most pressing challenges identified during user research, ensuring optimized performance, user satisfaction, and seamless integration into existing workflows.
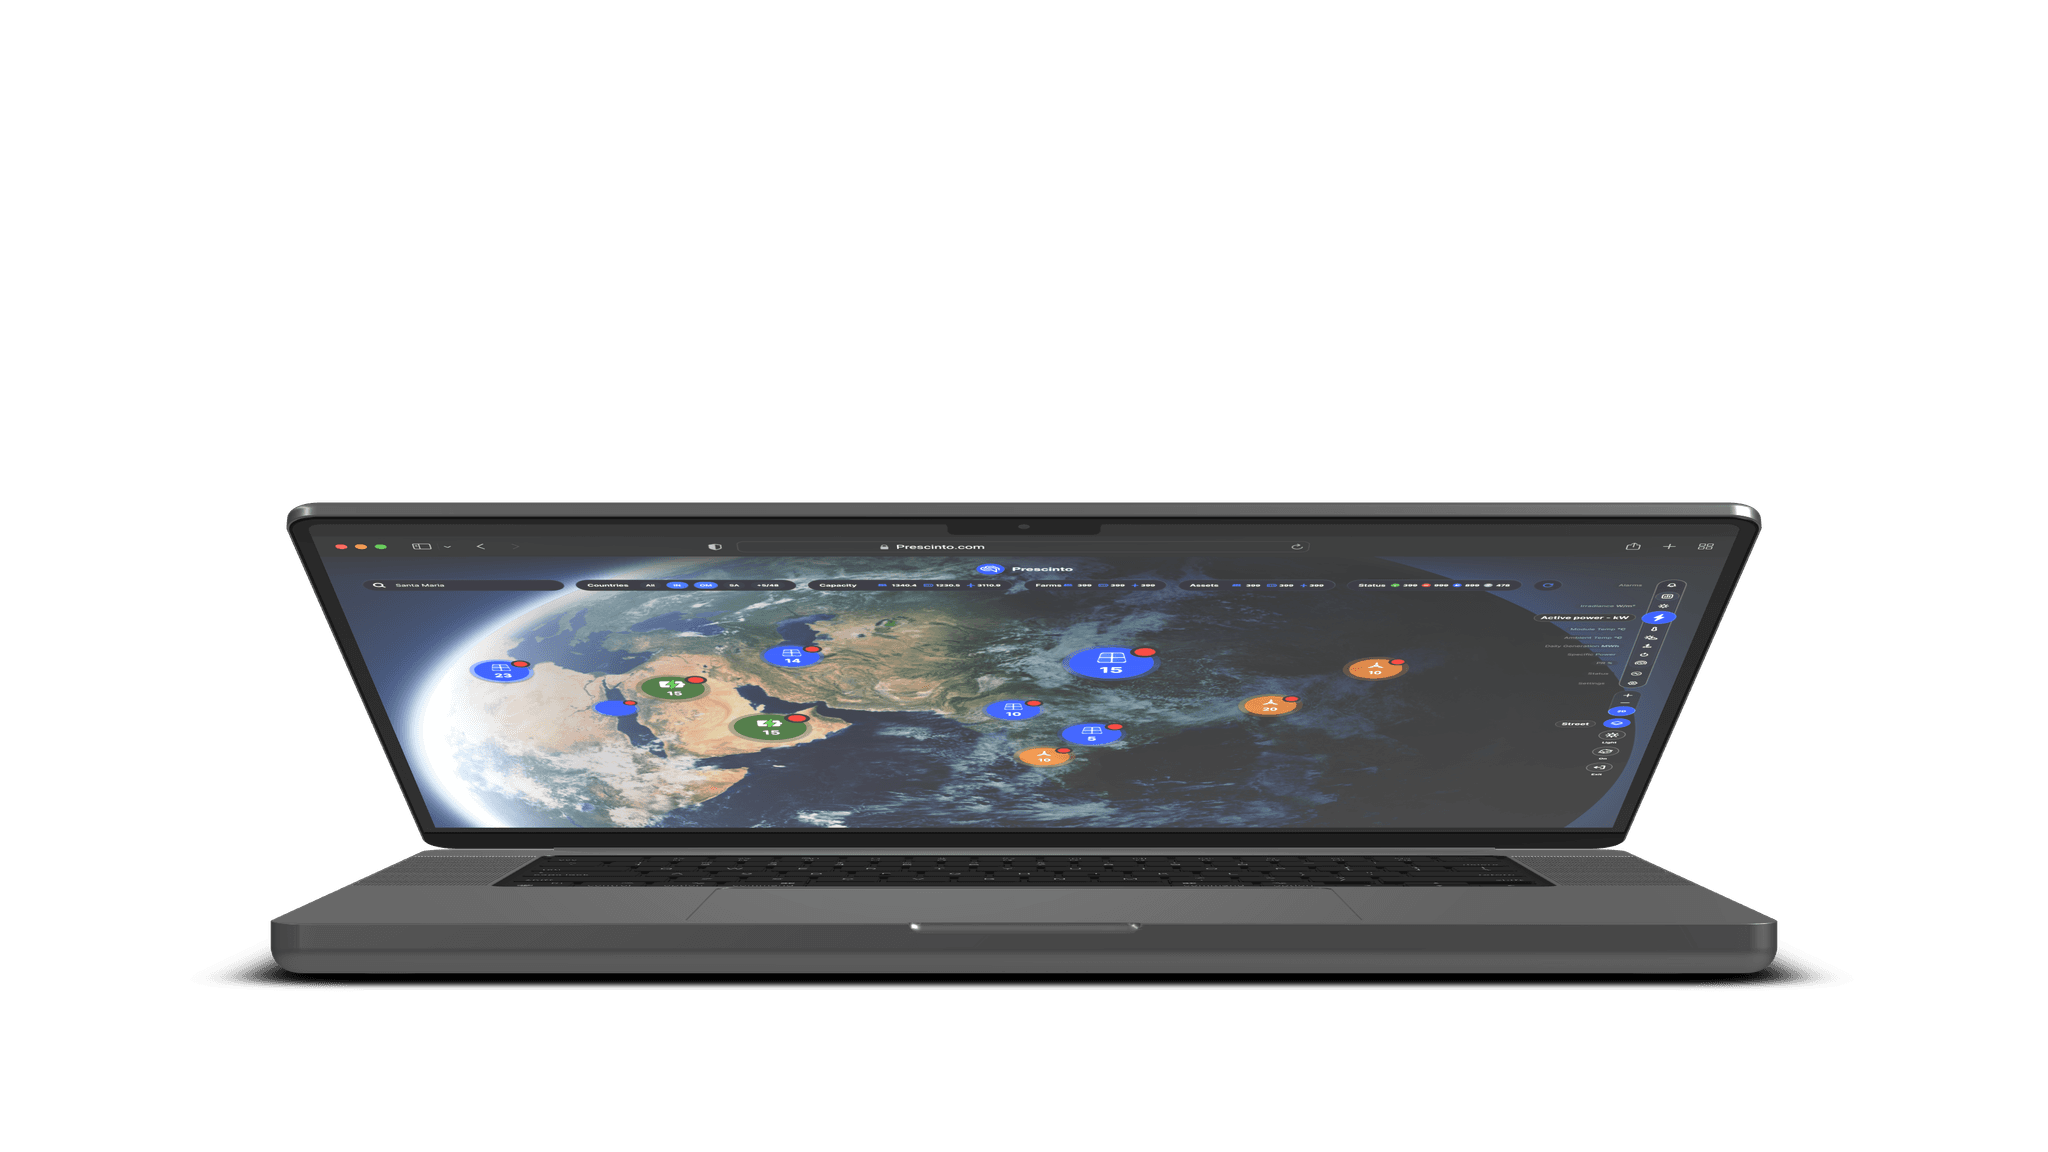
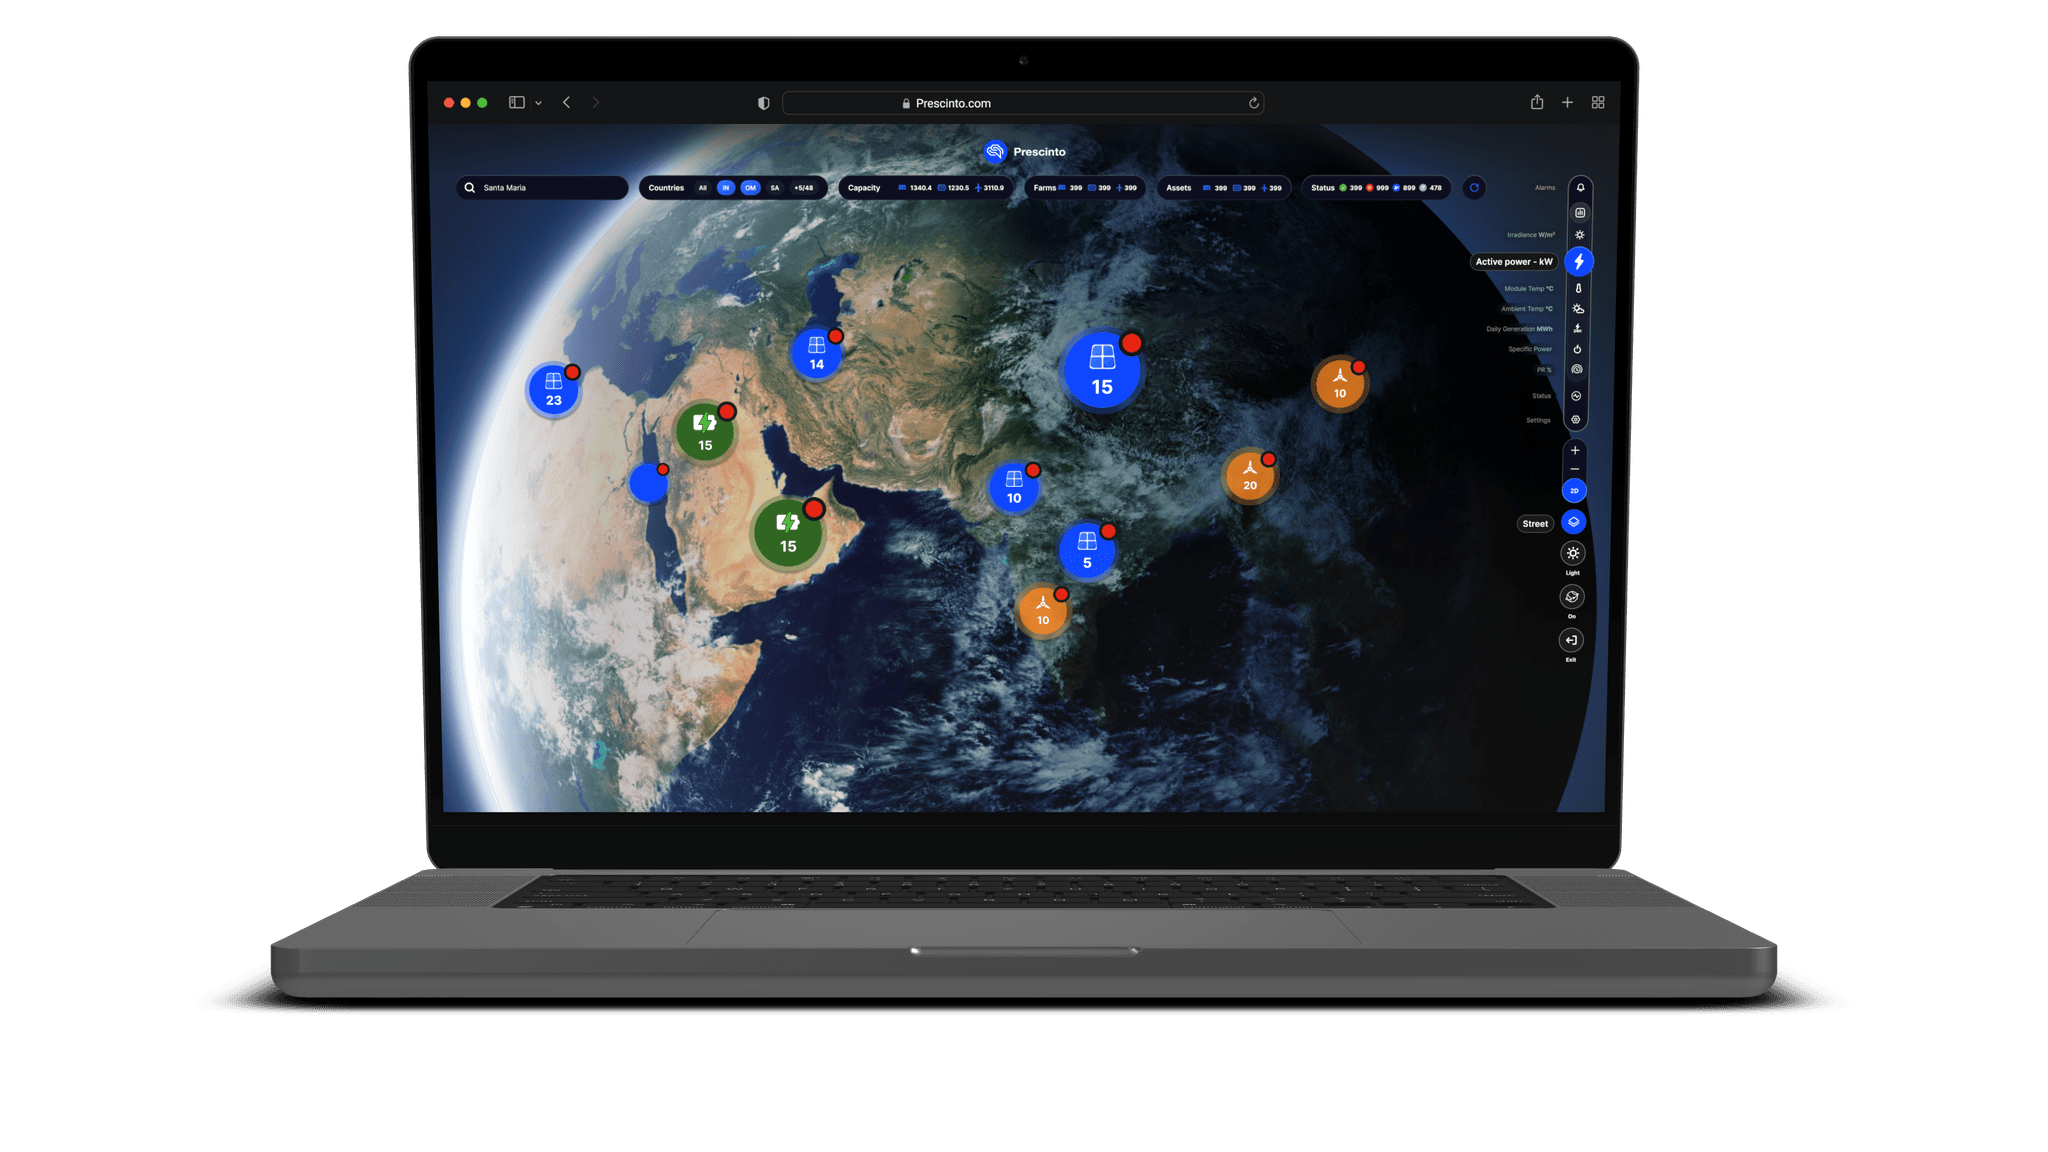
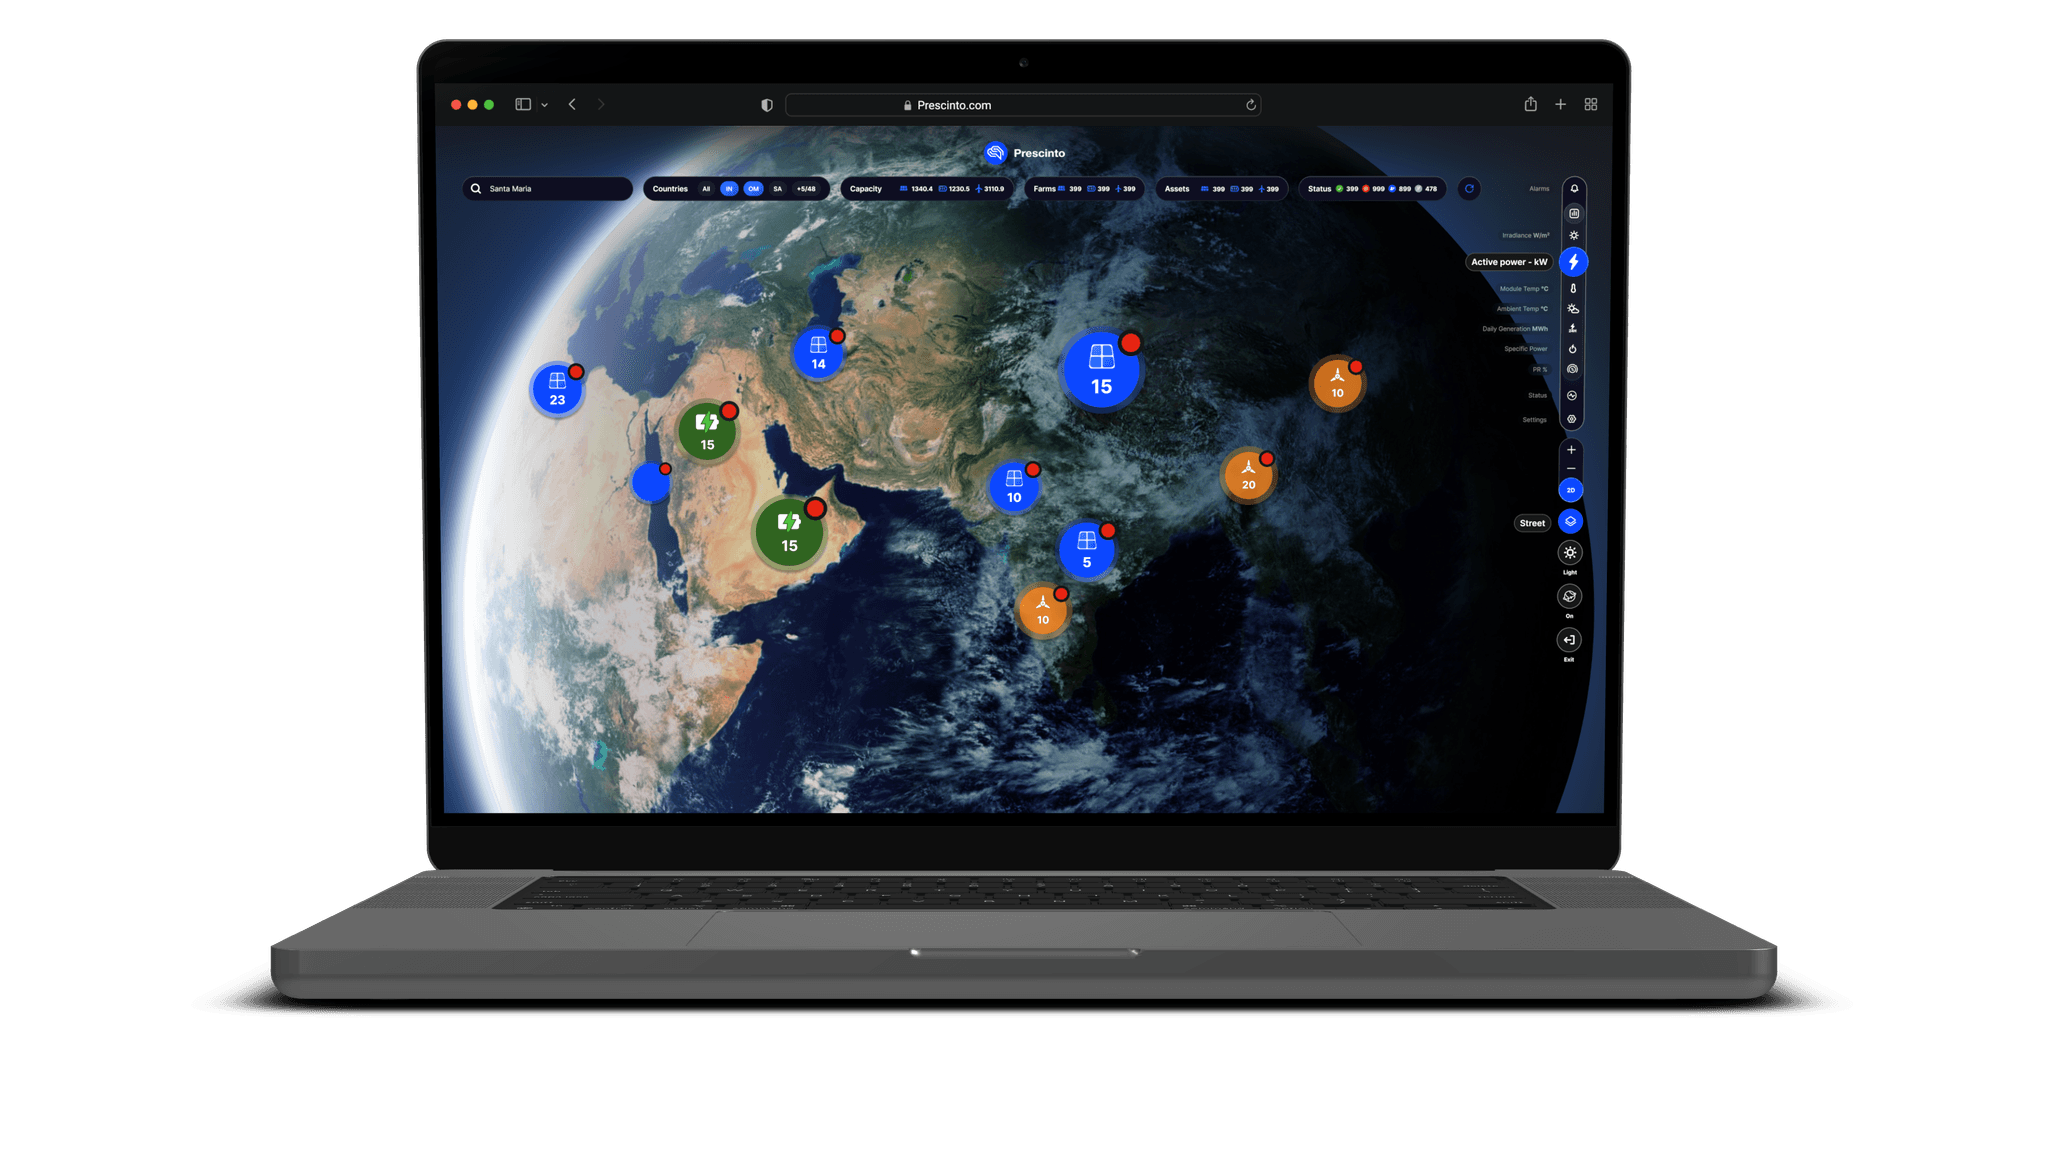
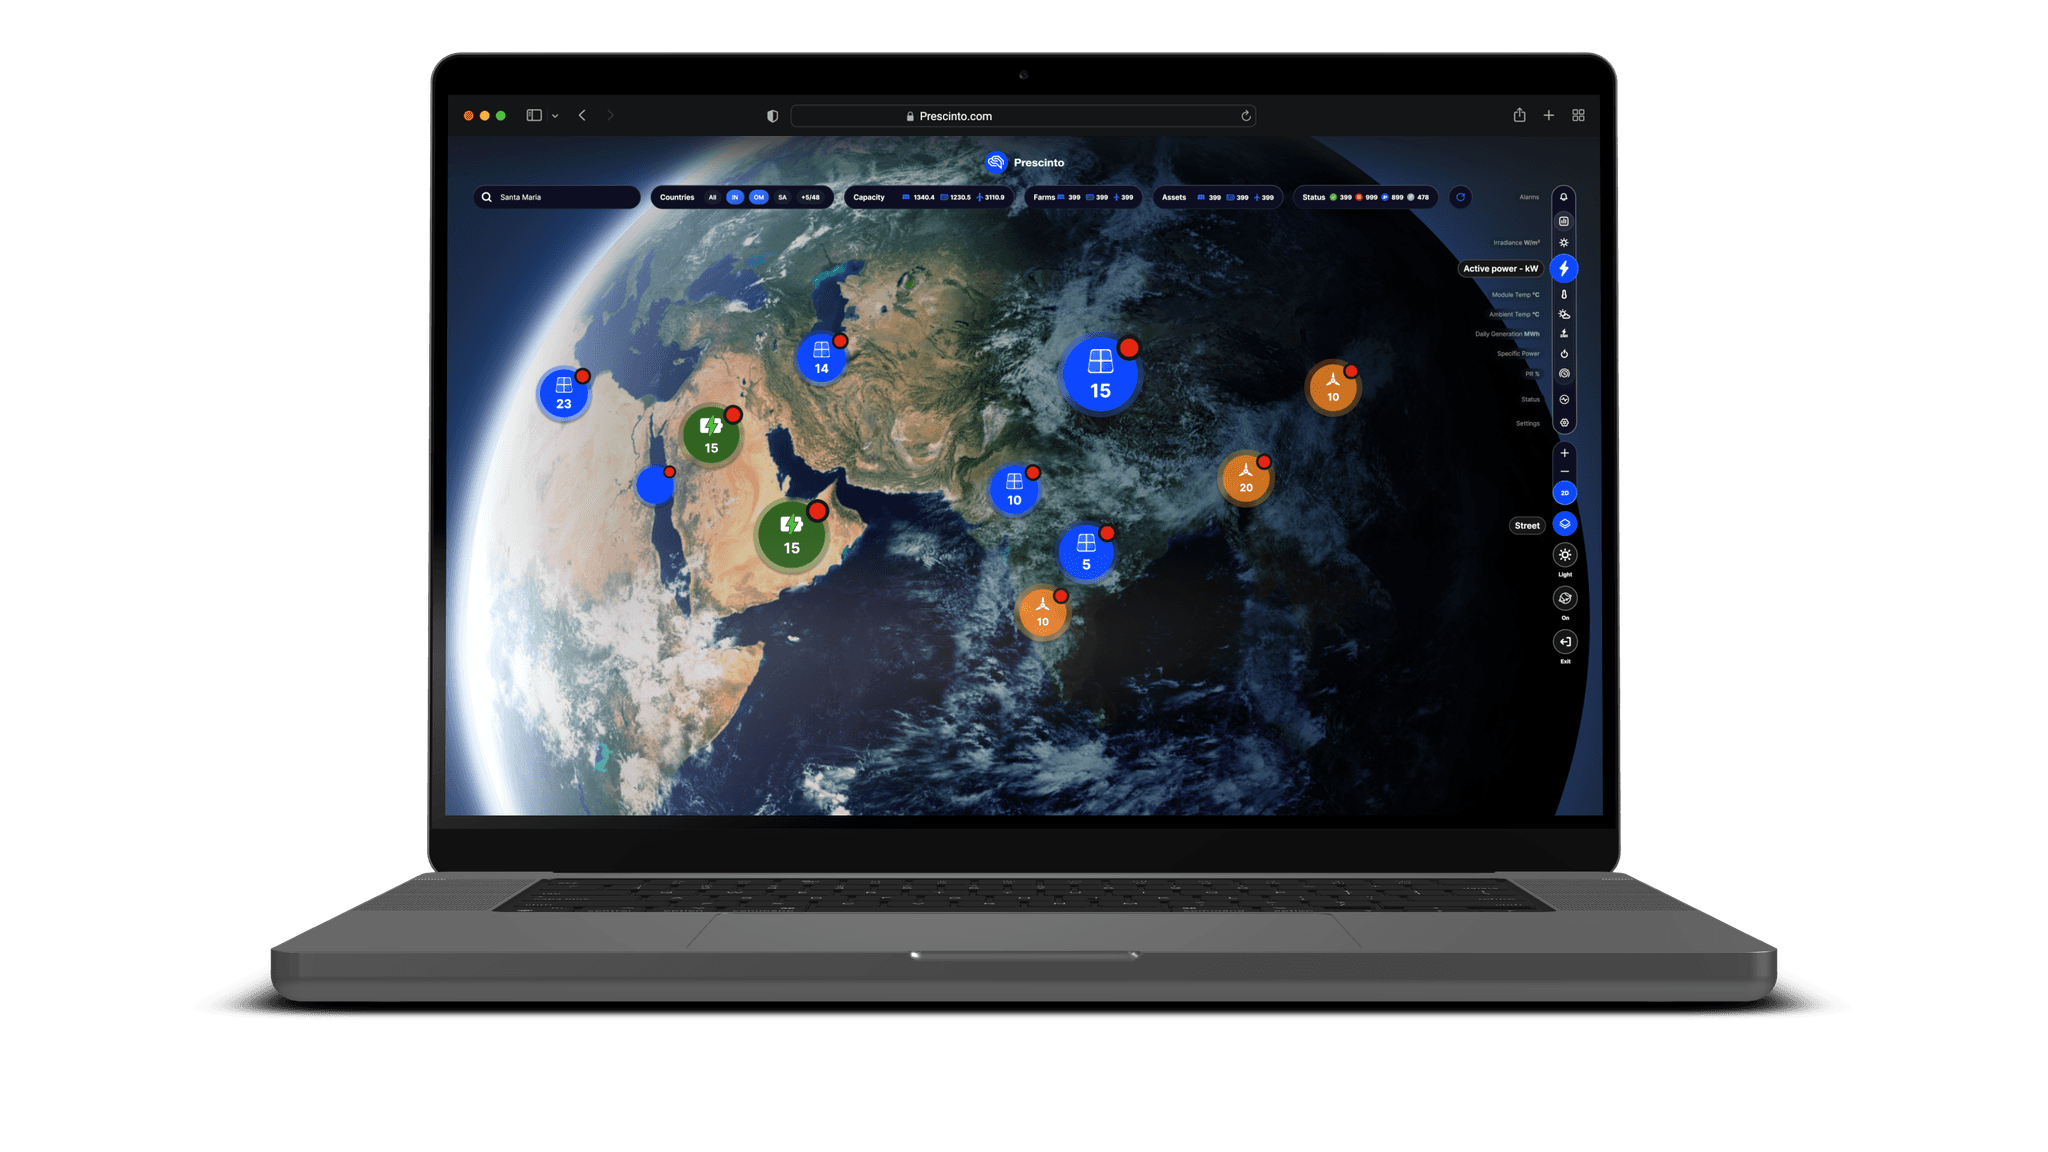
Now available to everyone
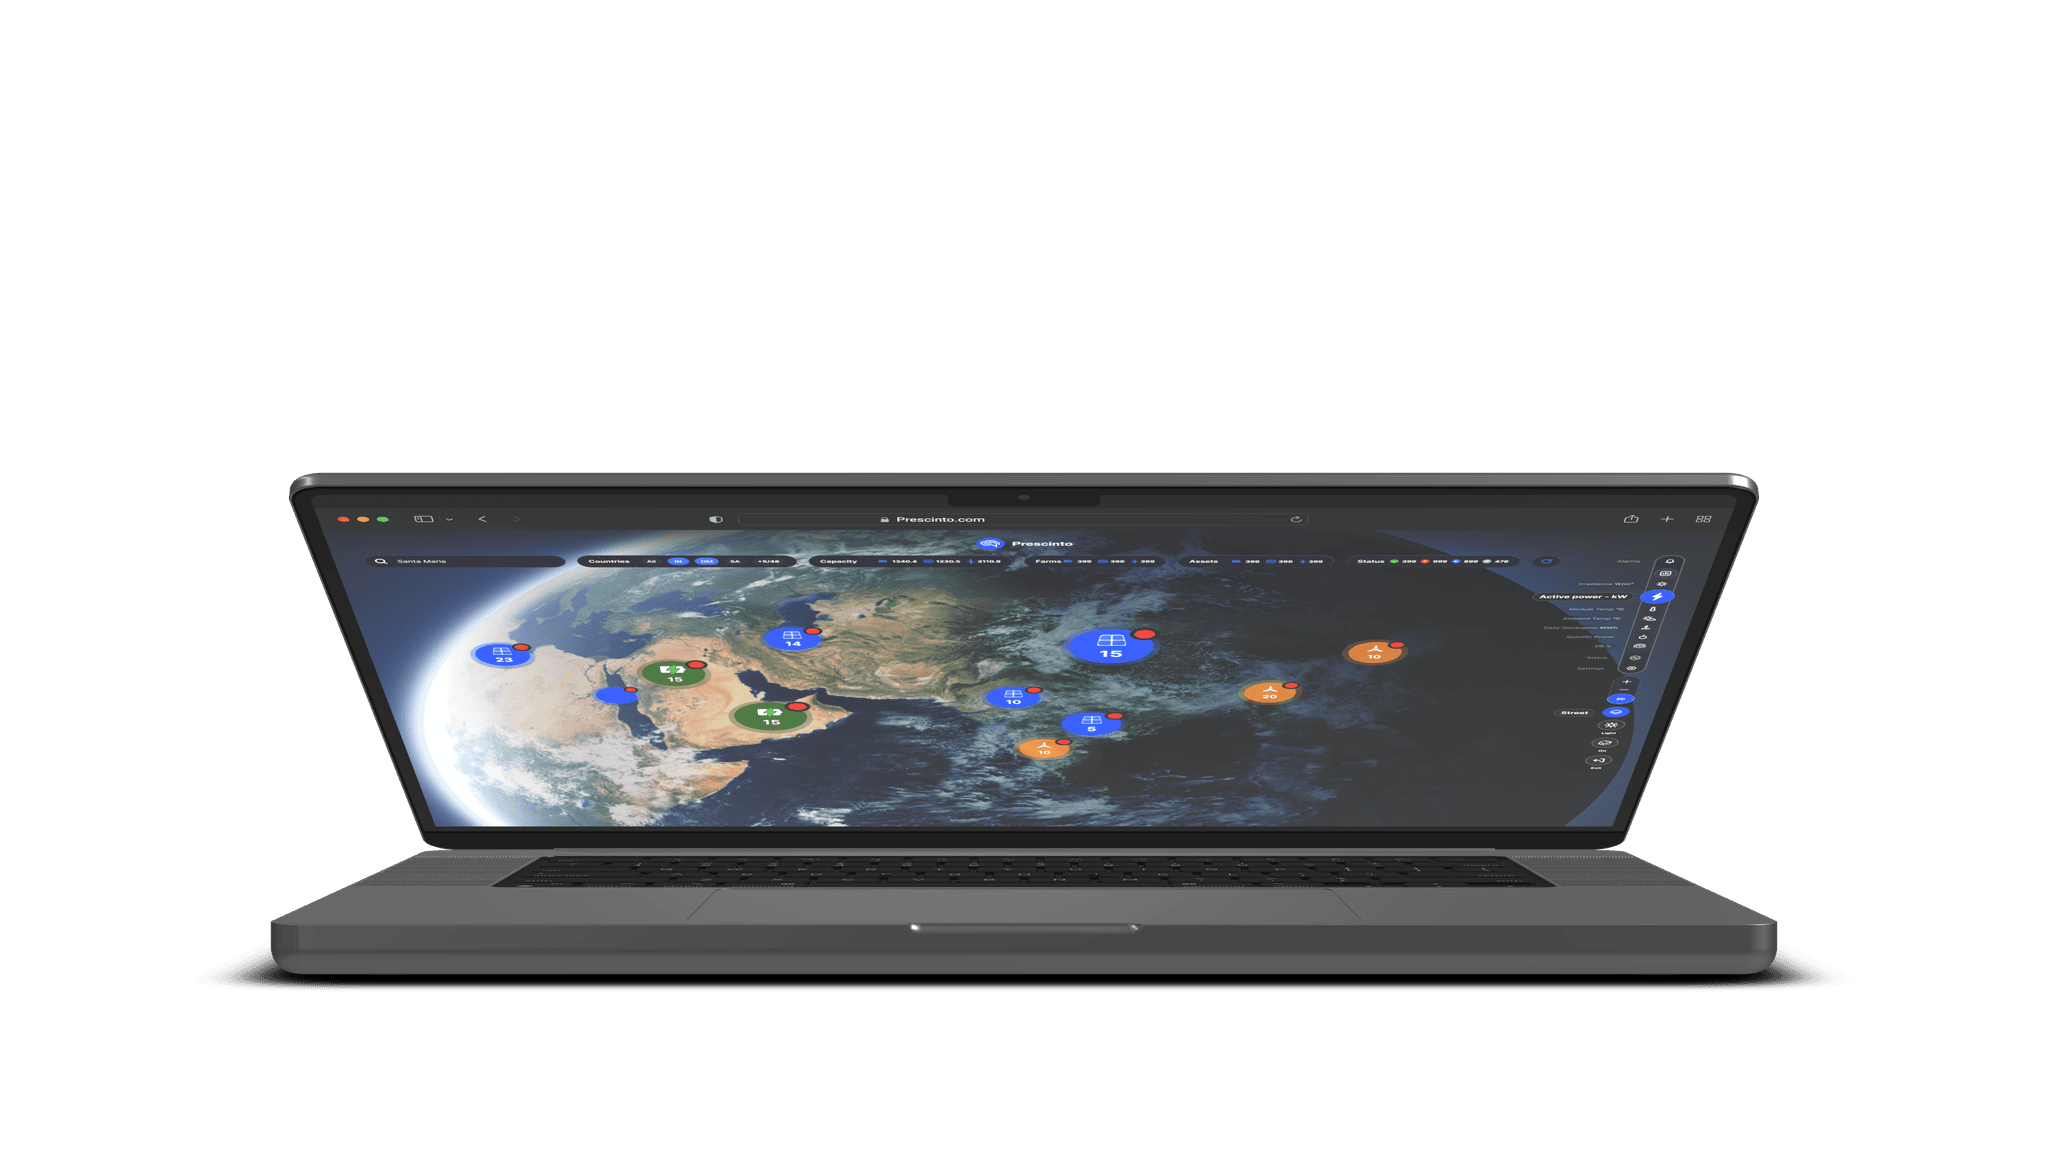
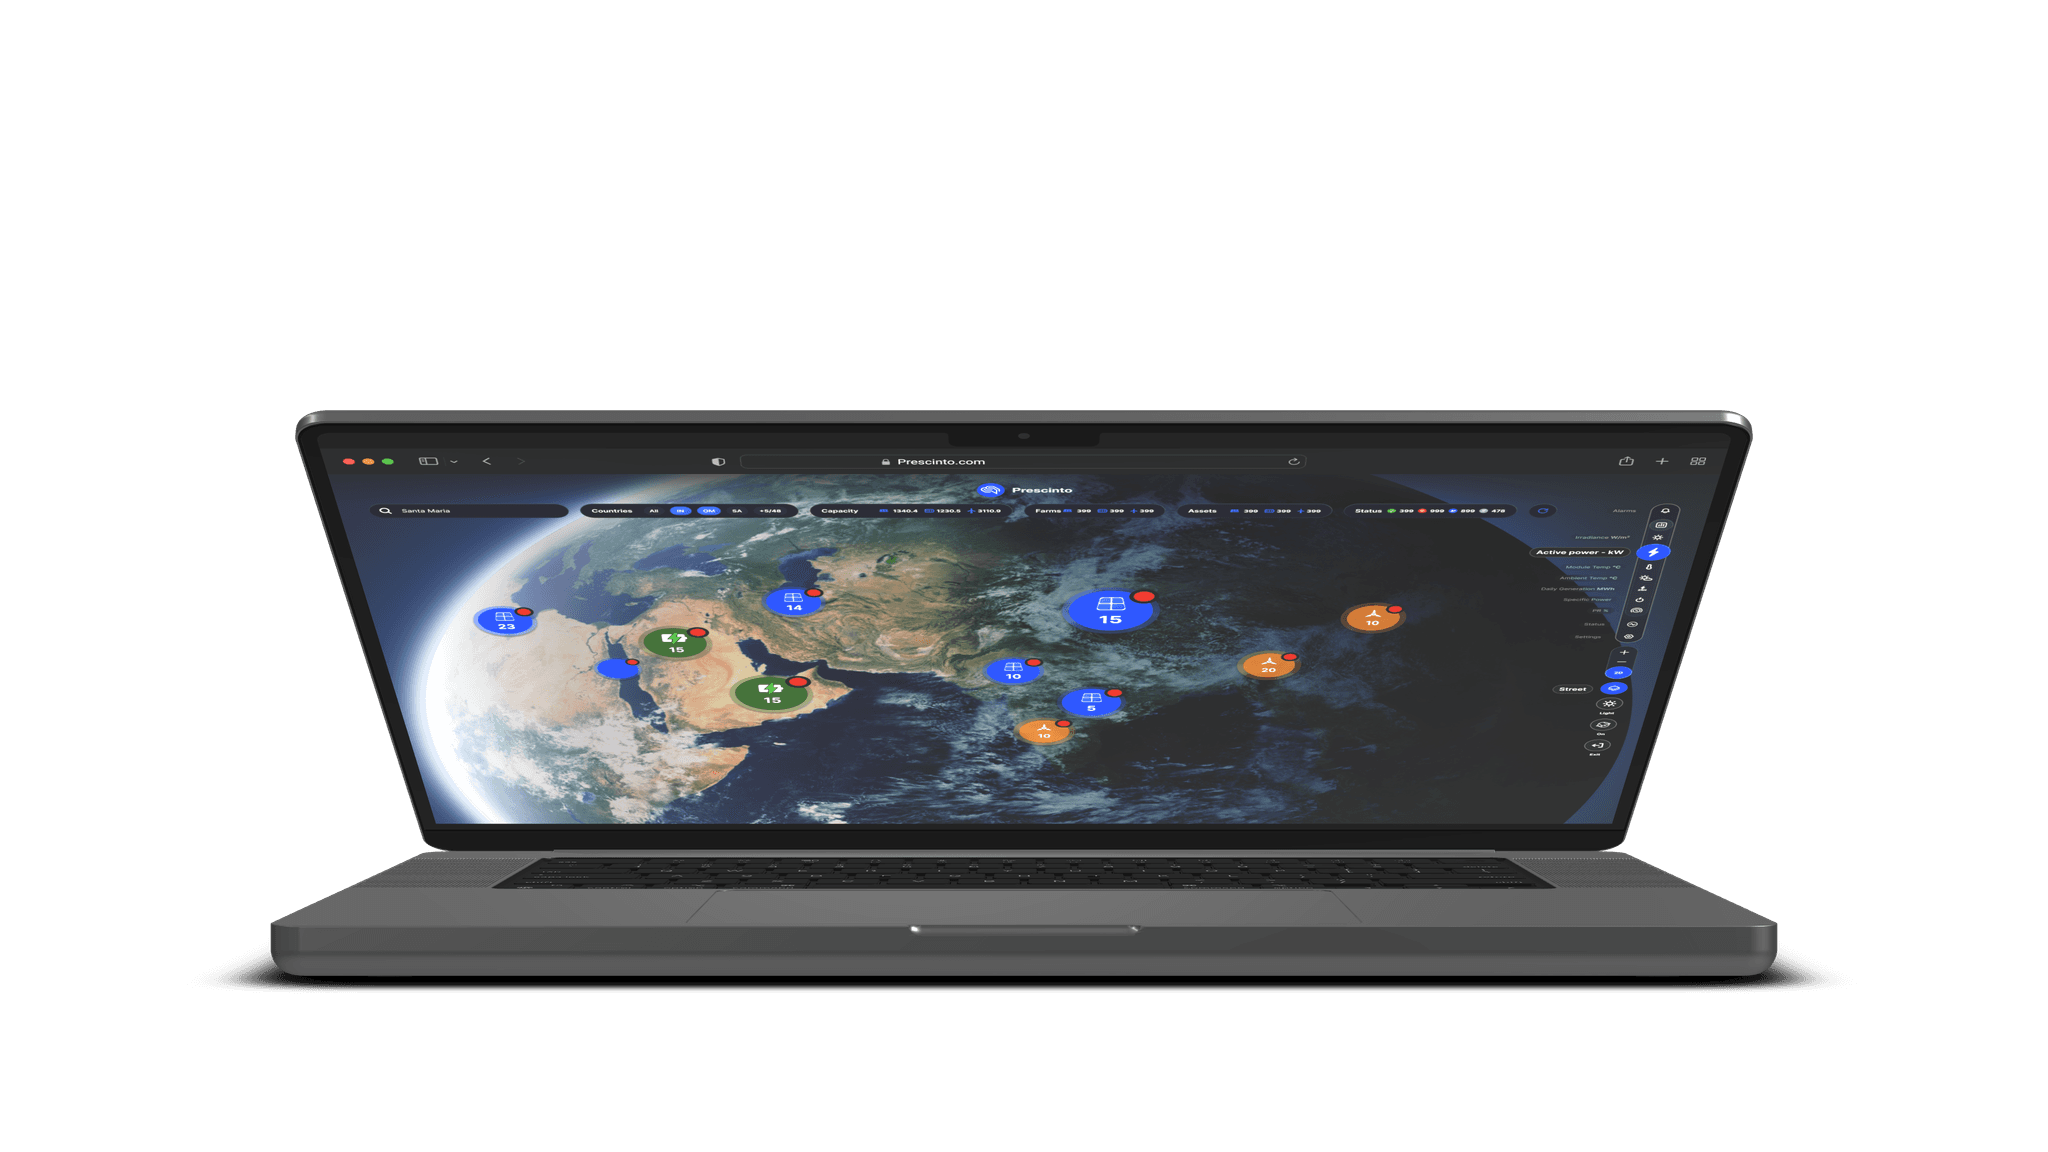
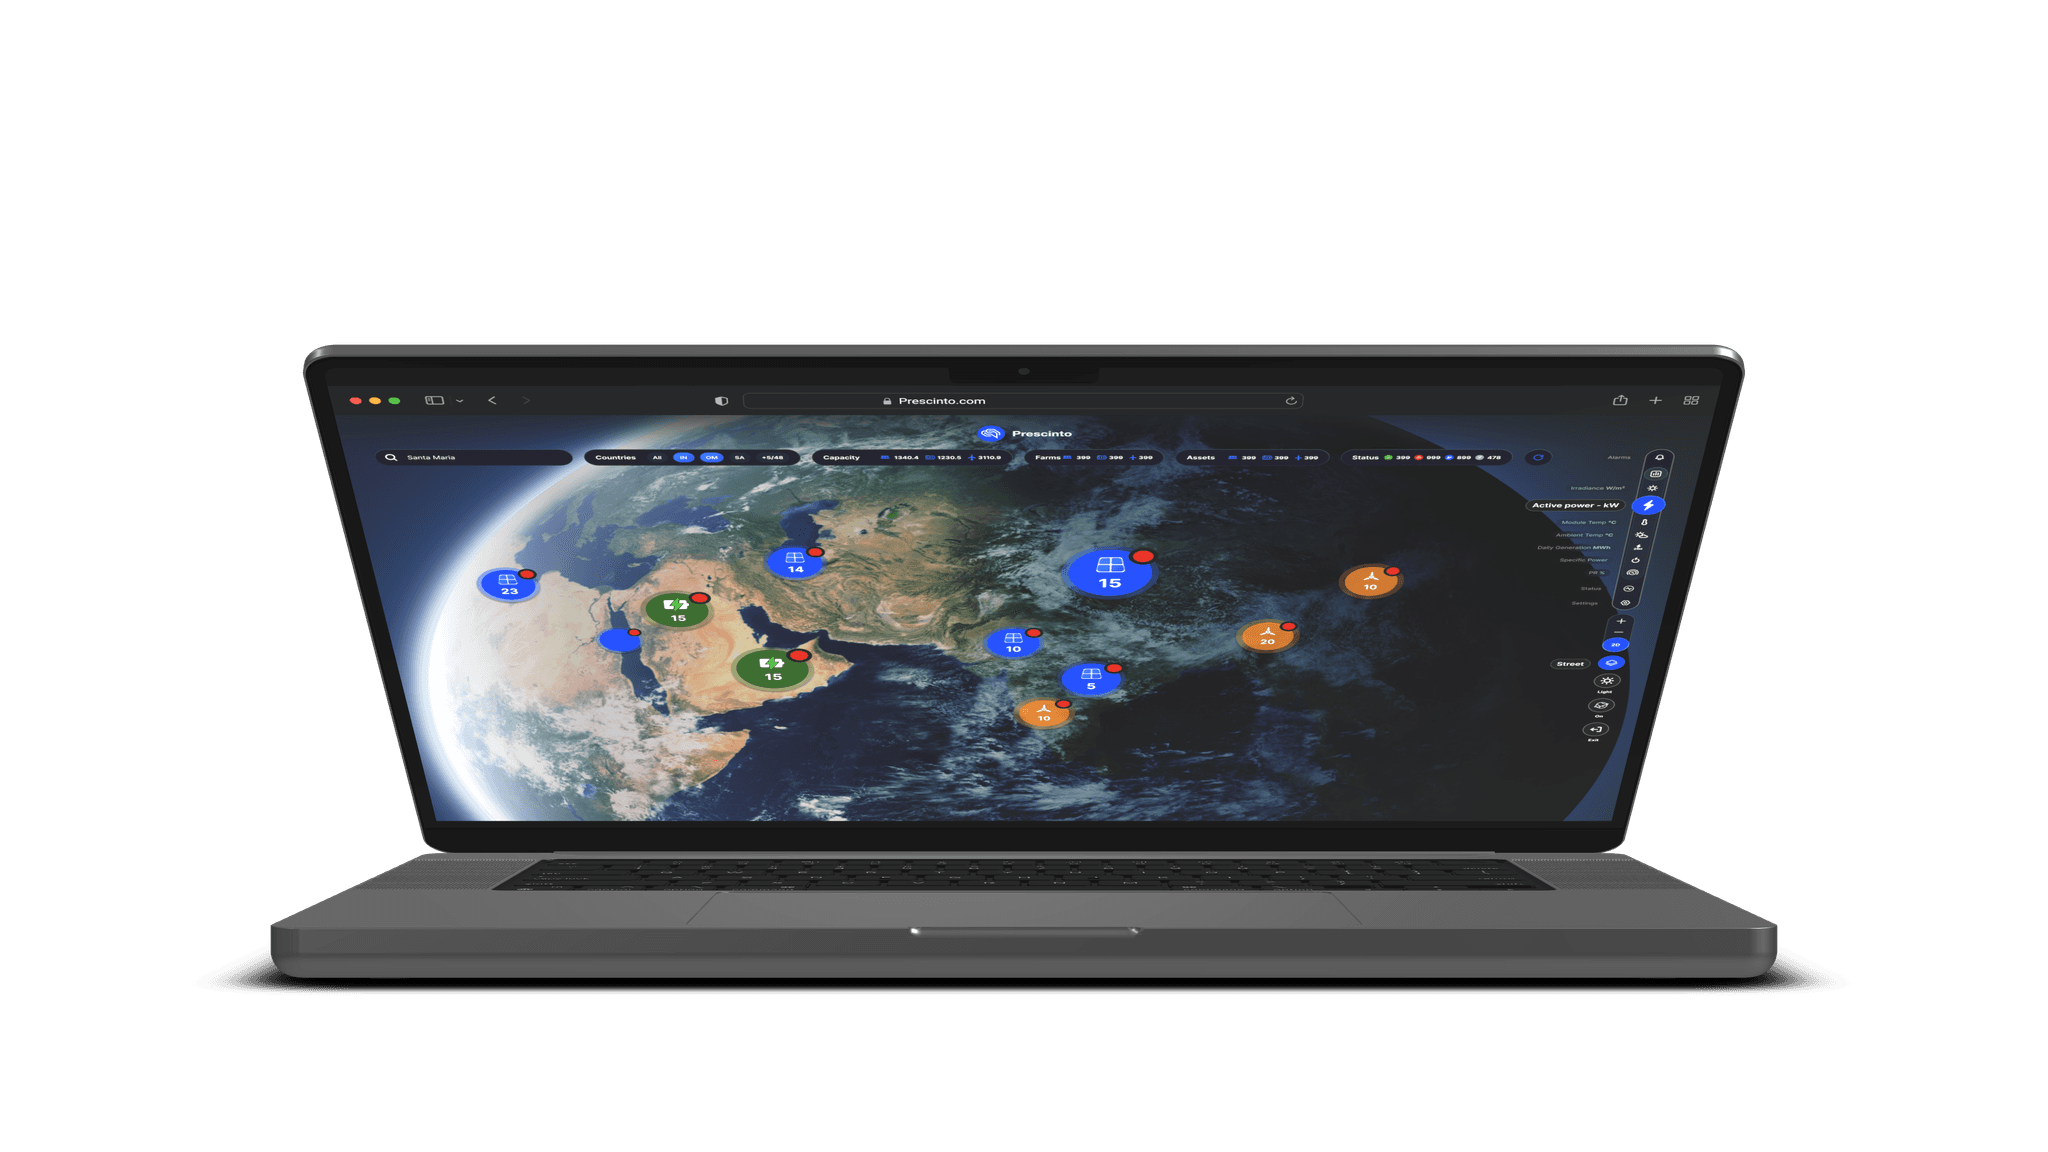
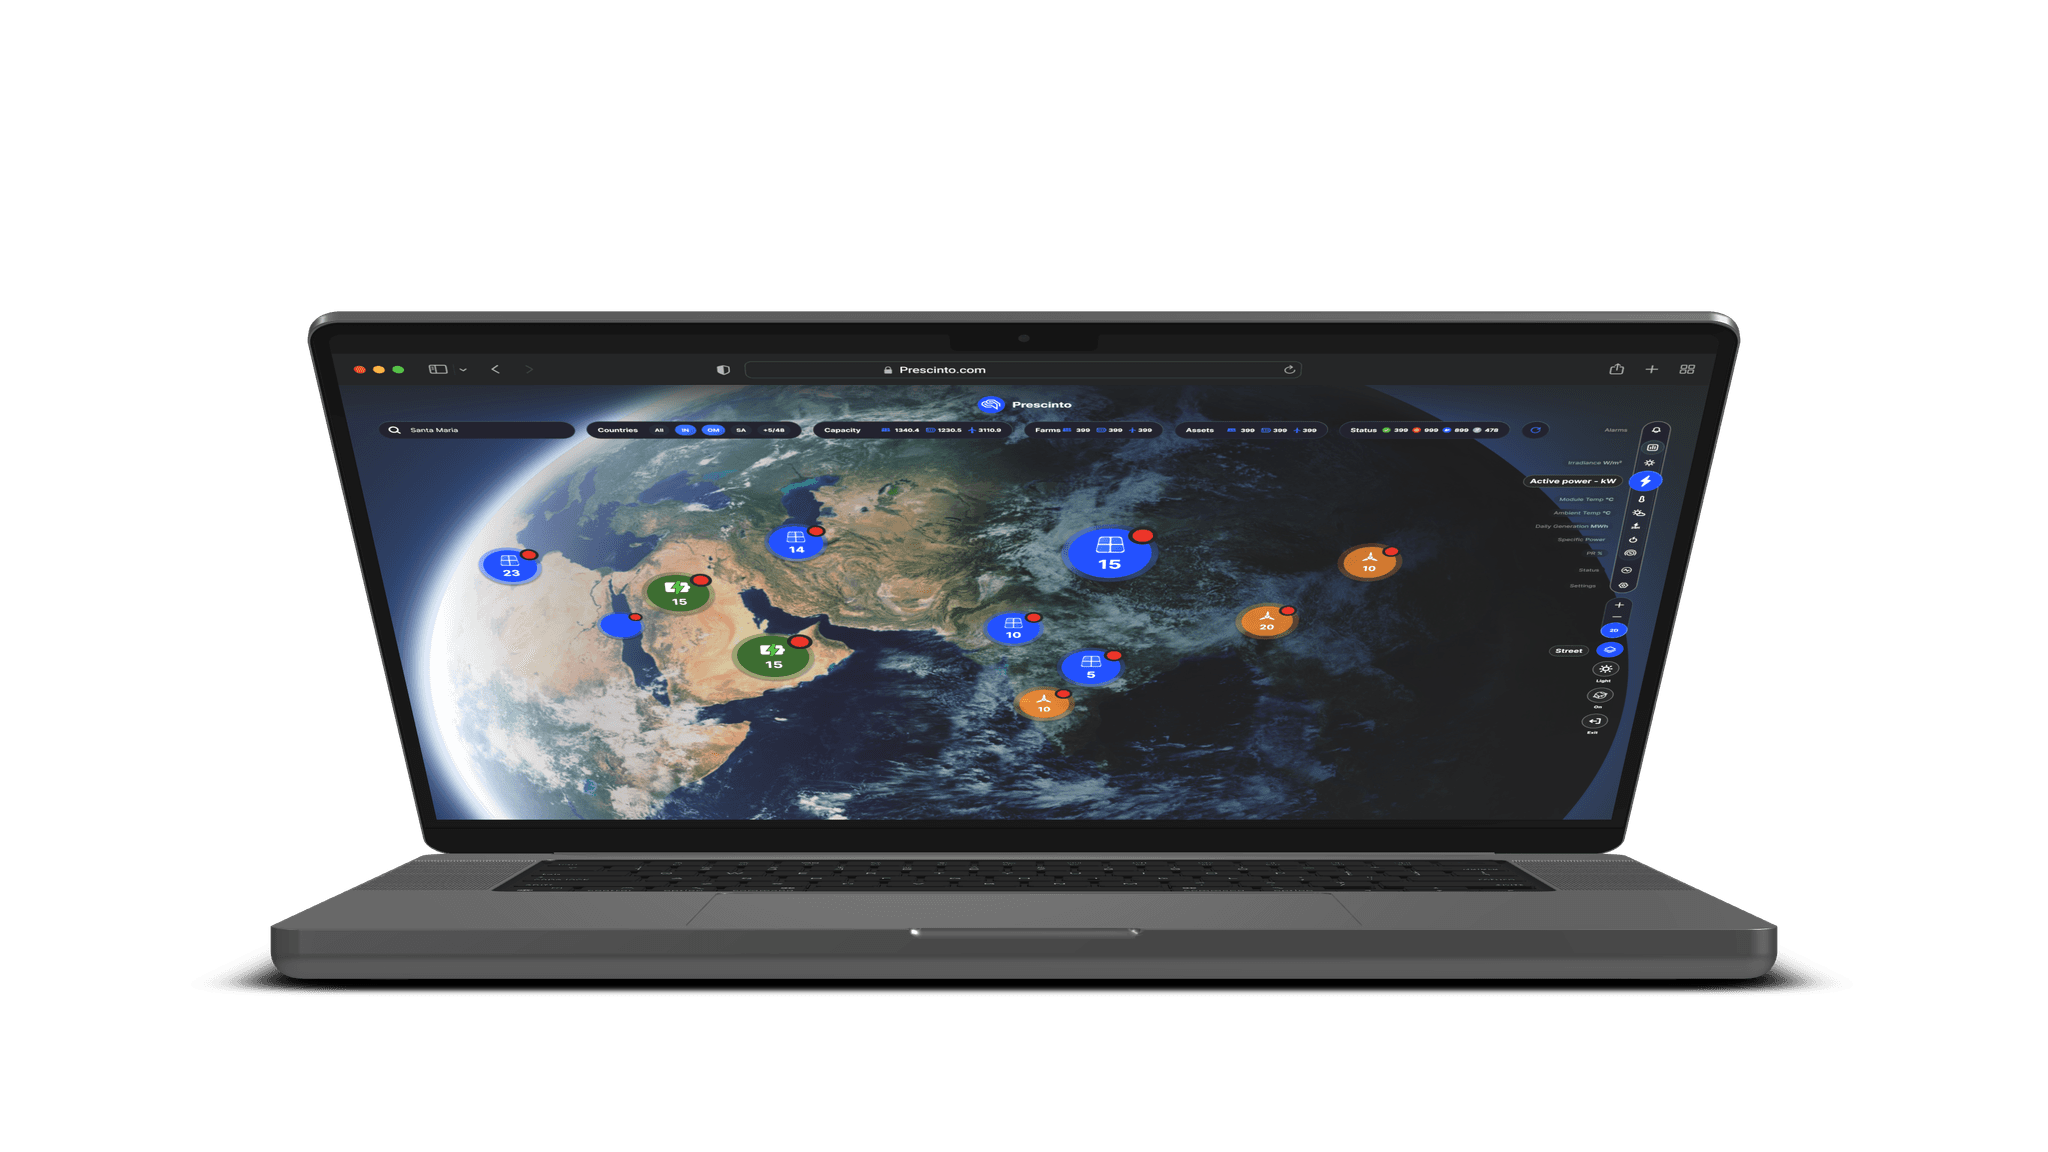
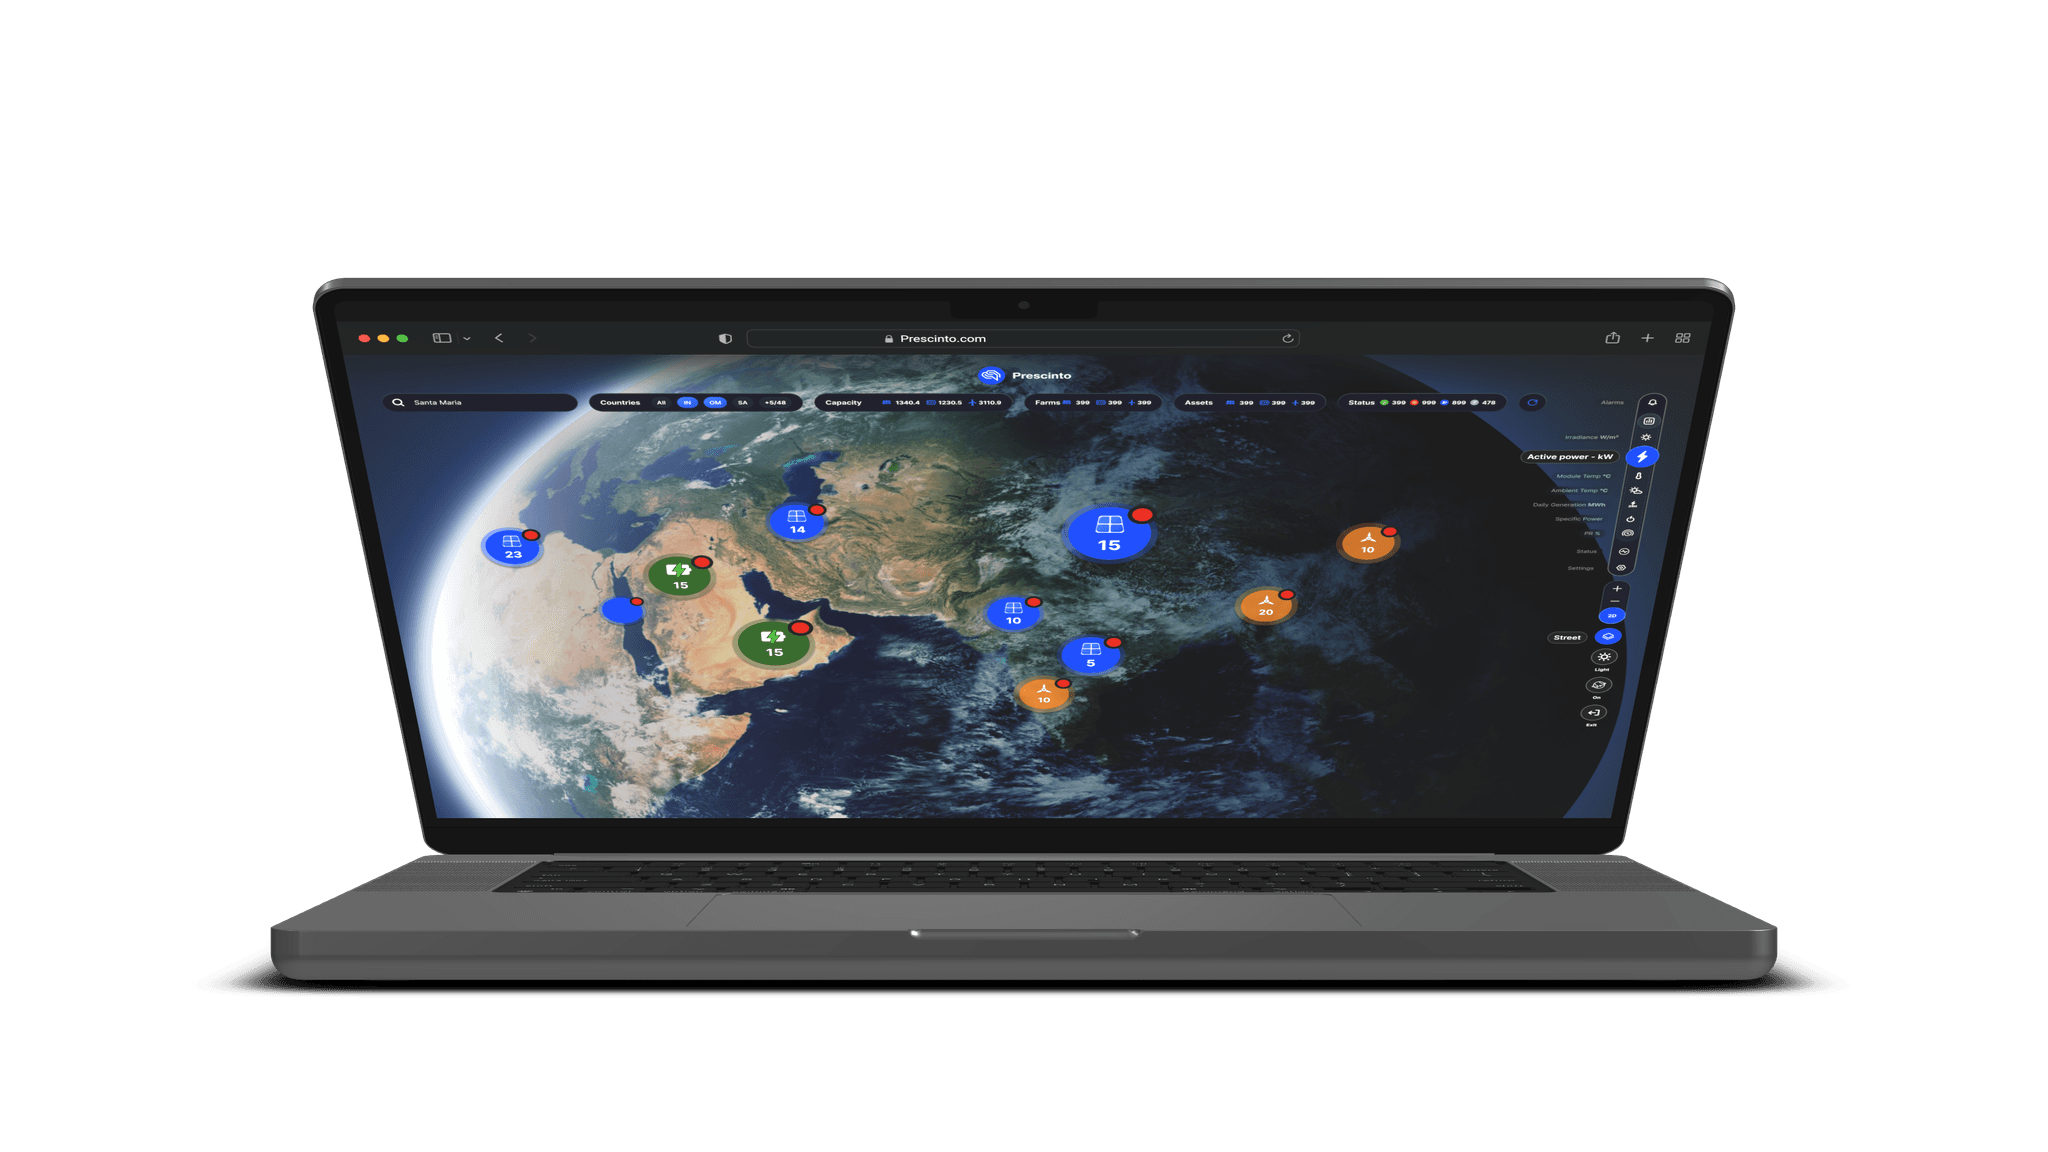
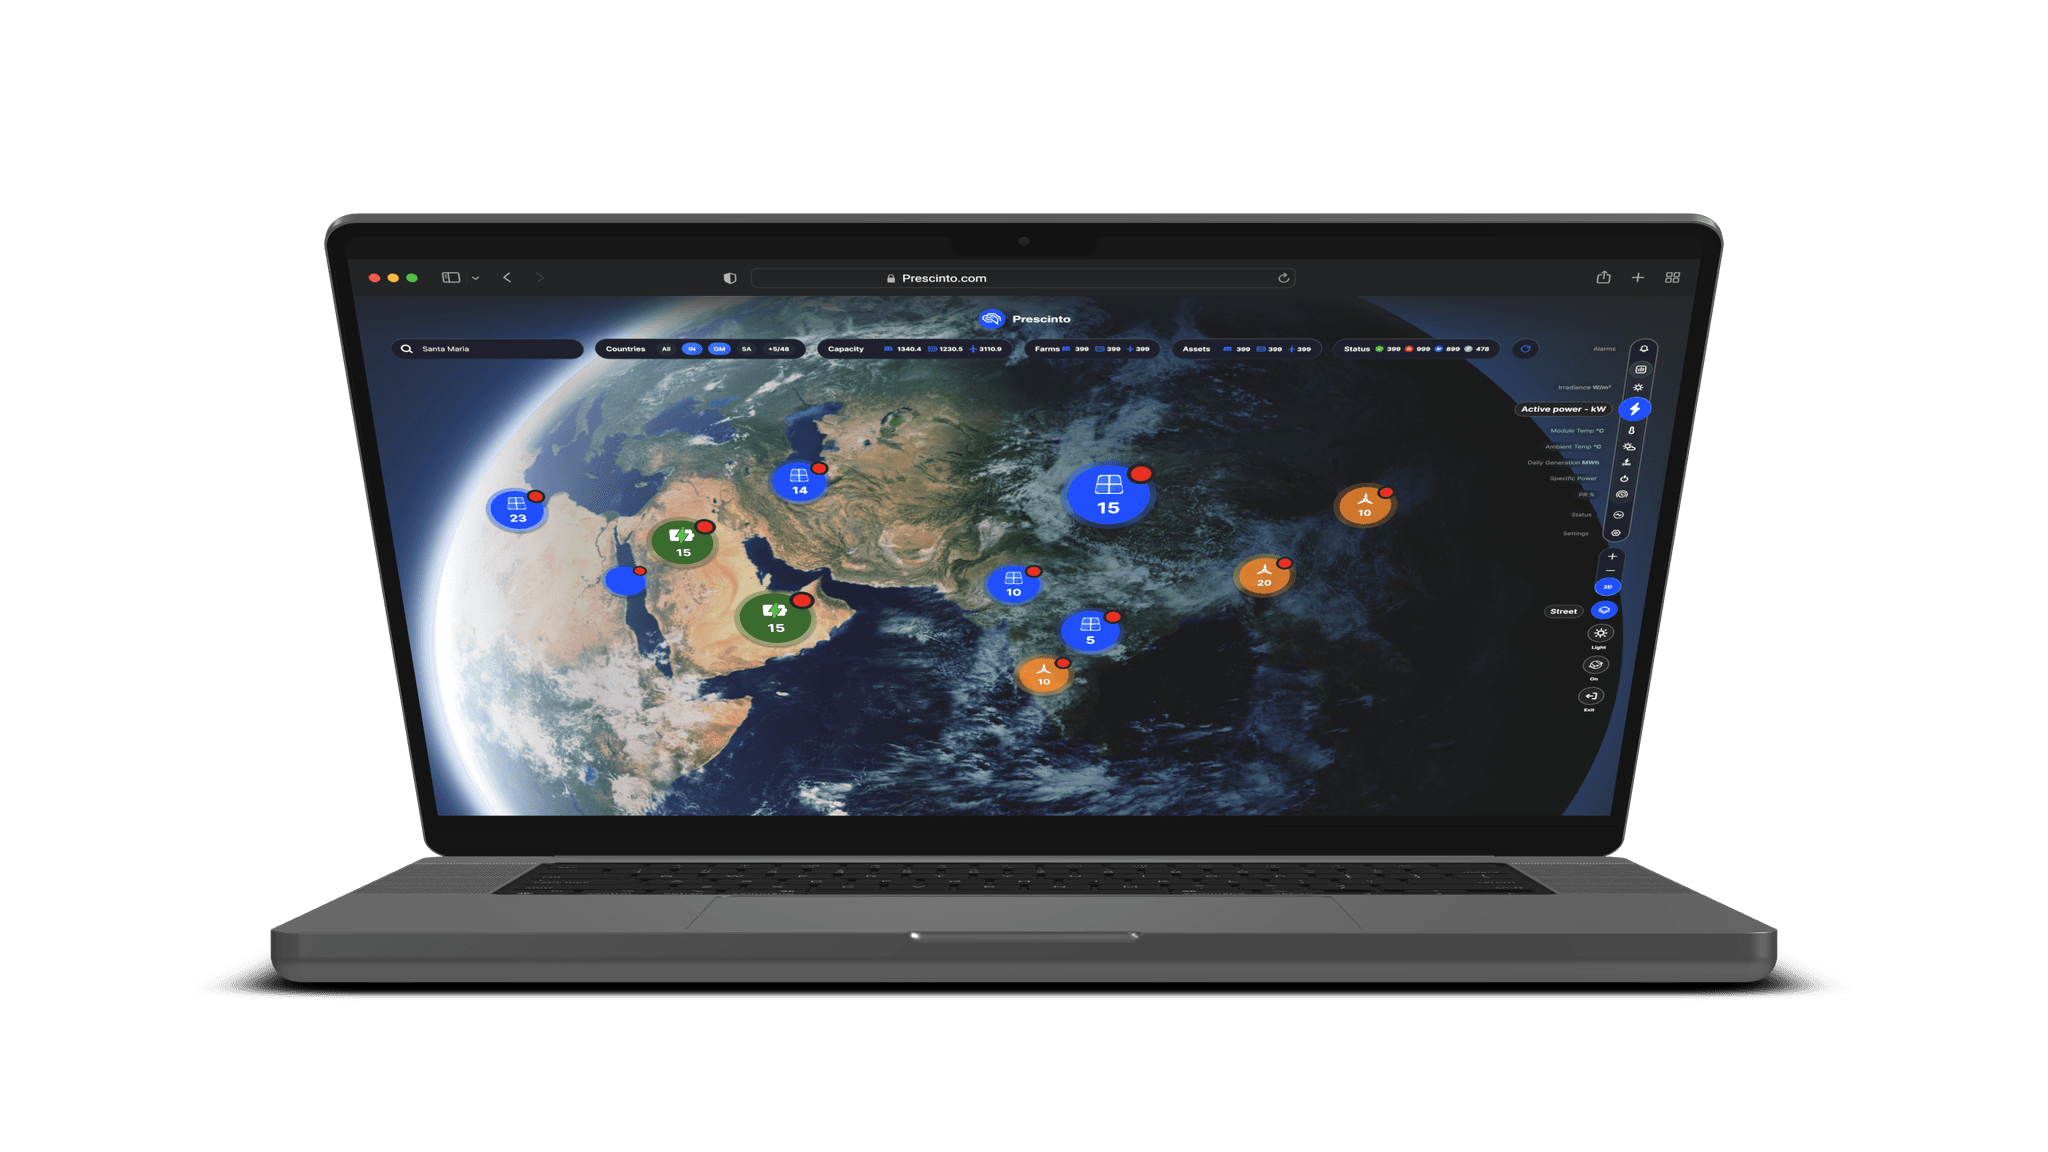
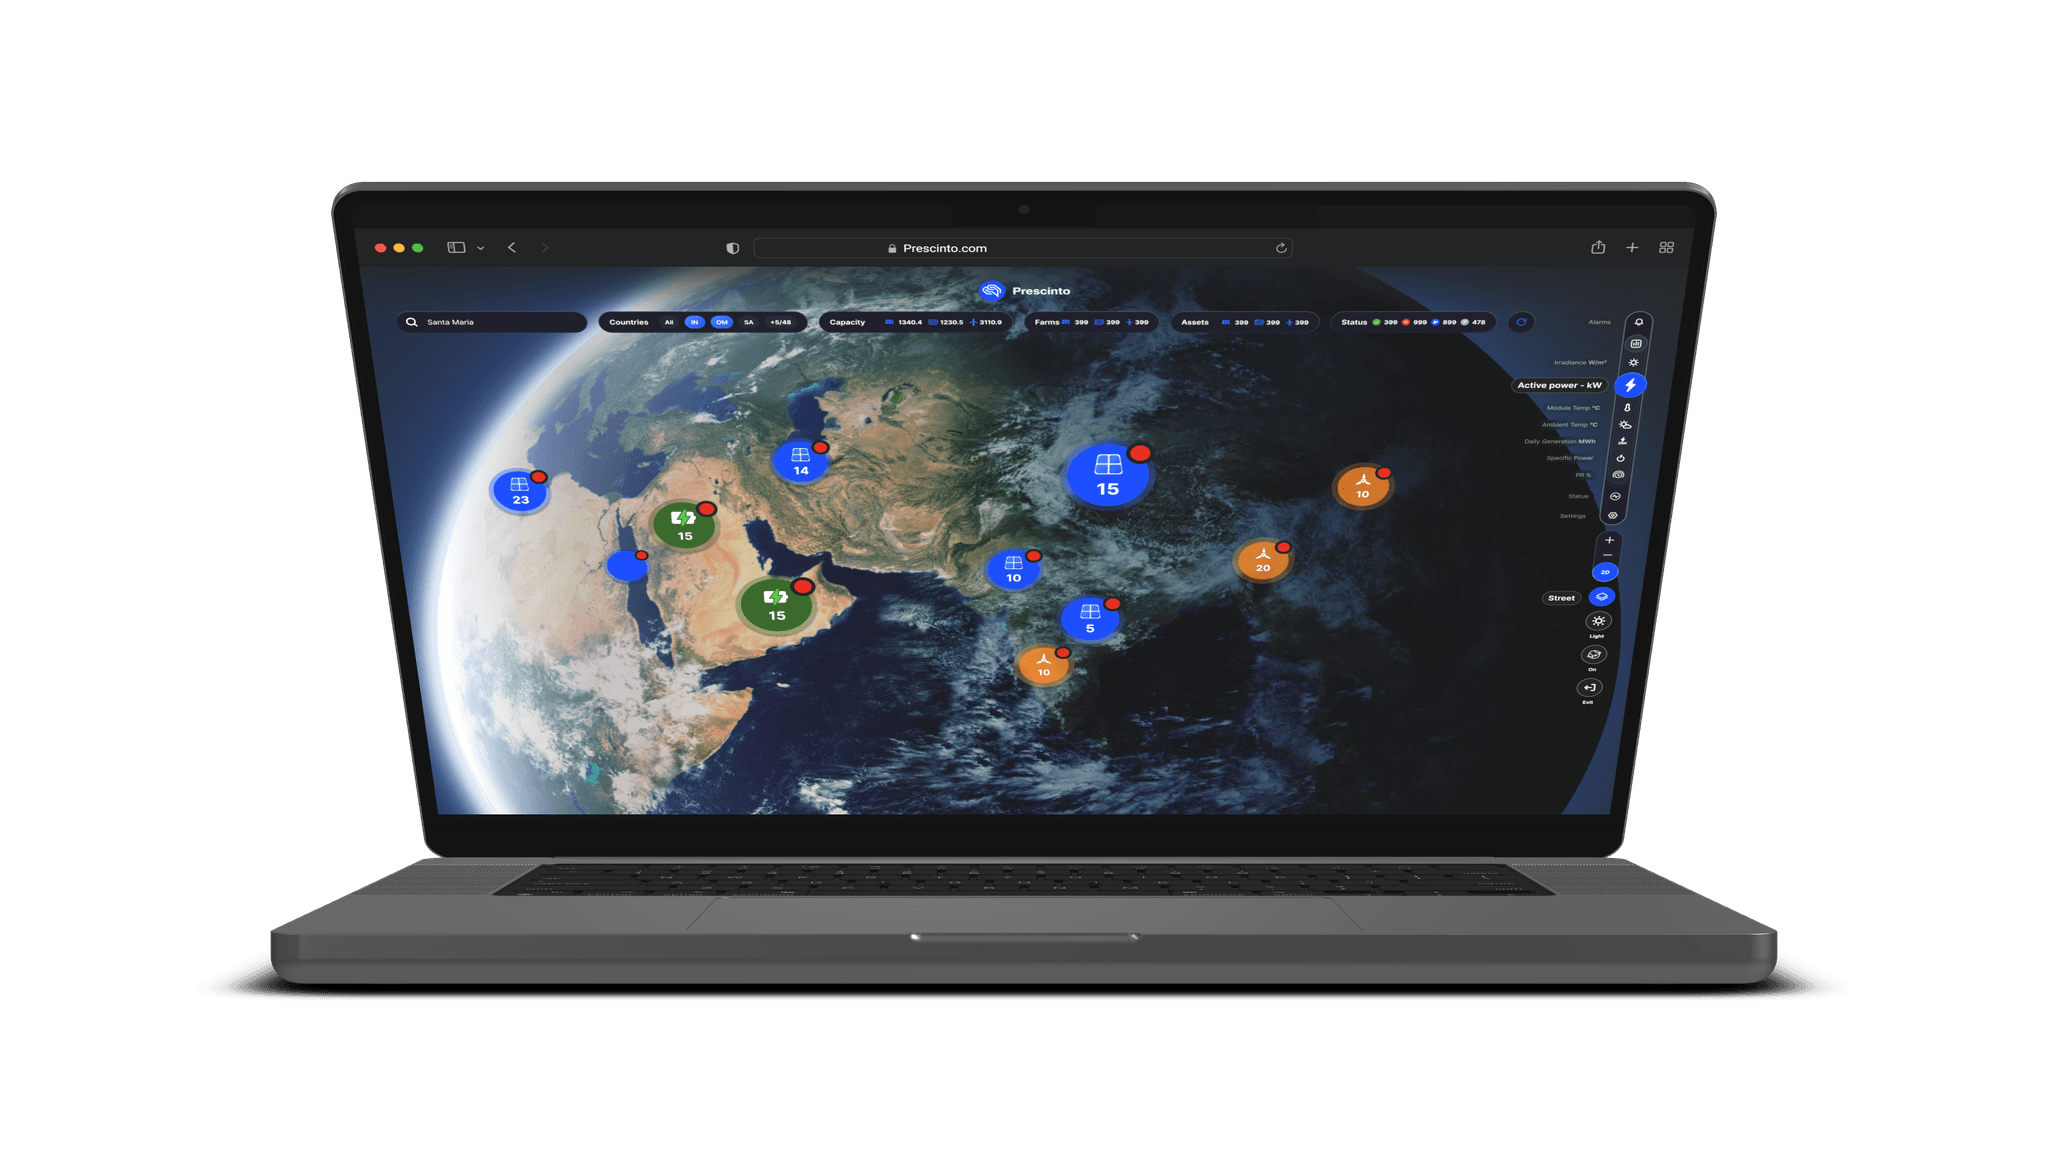
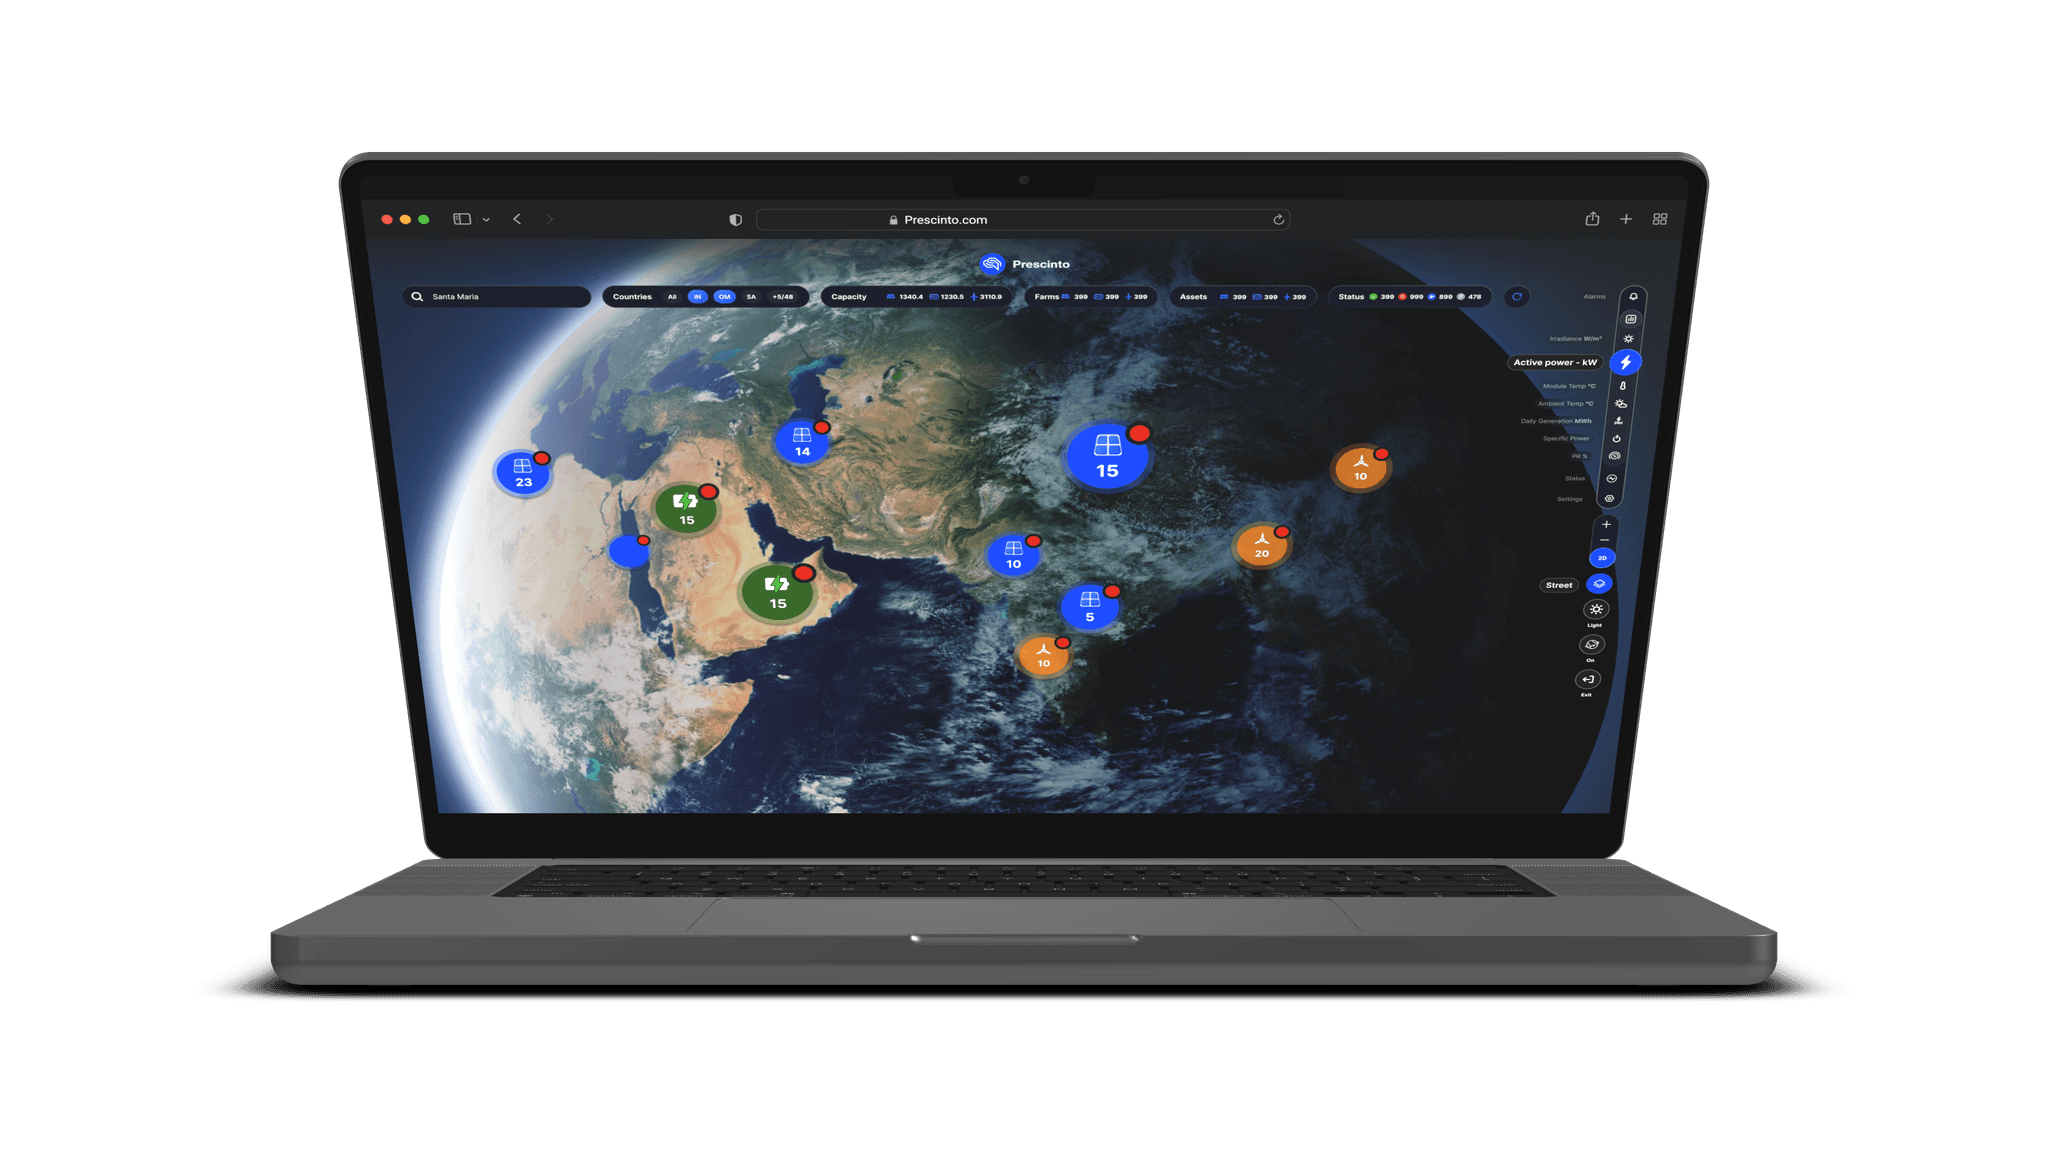
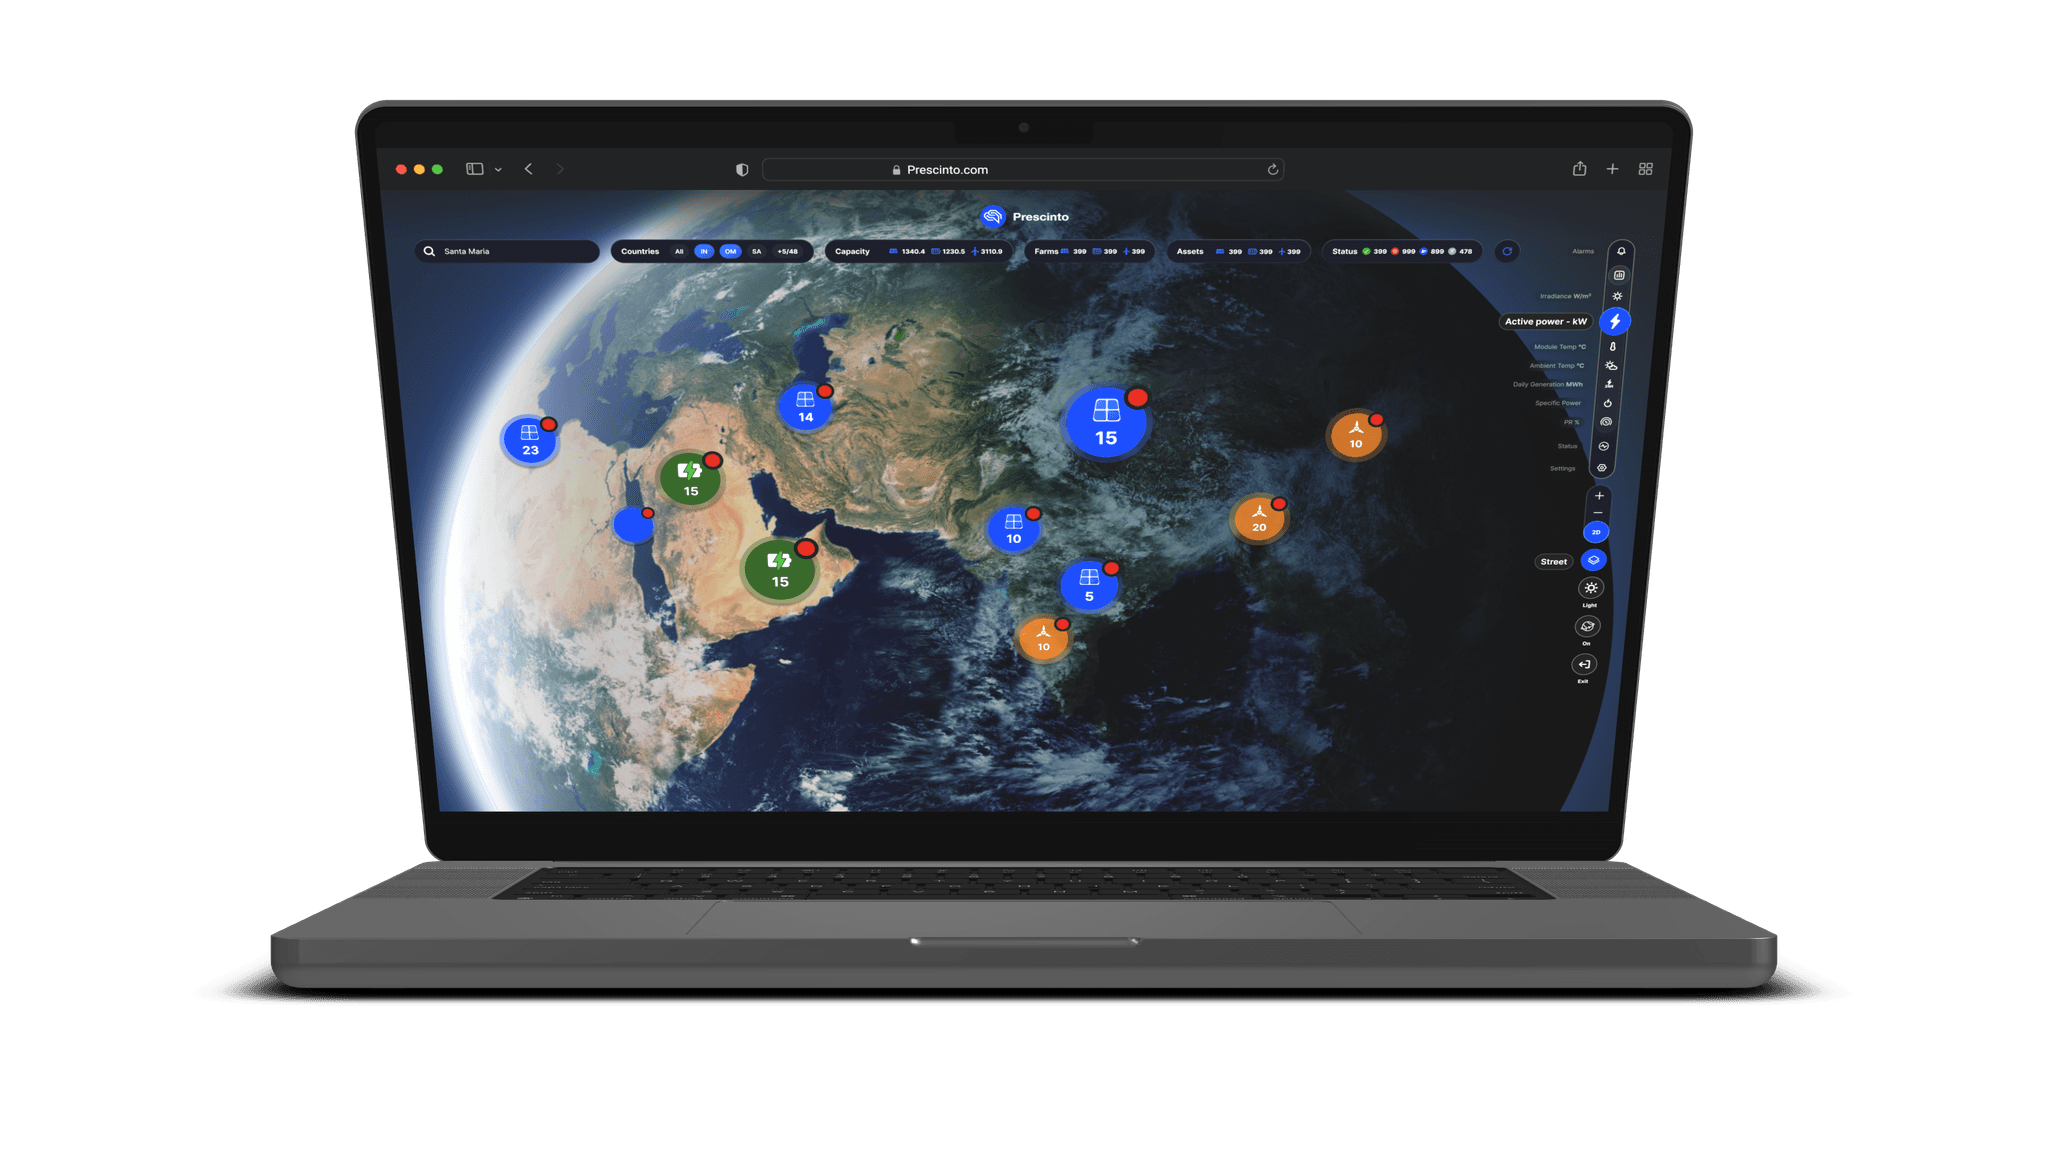
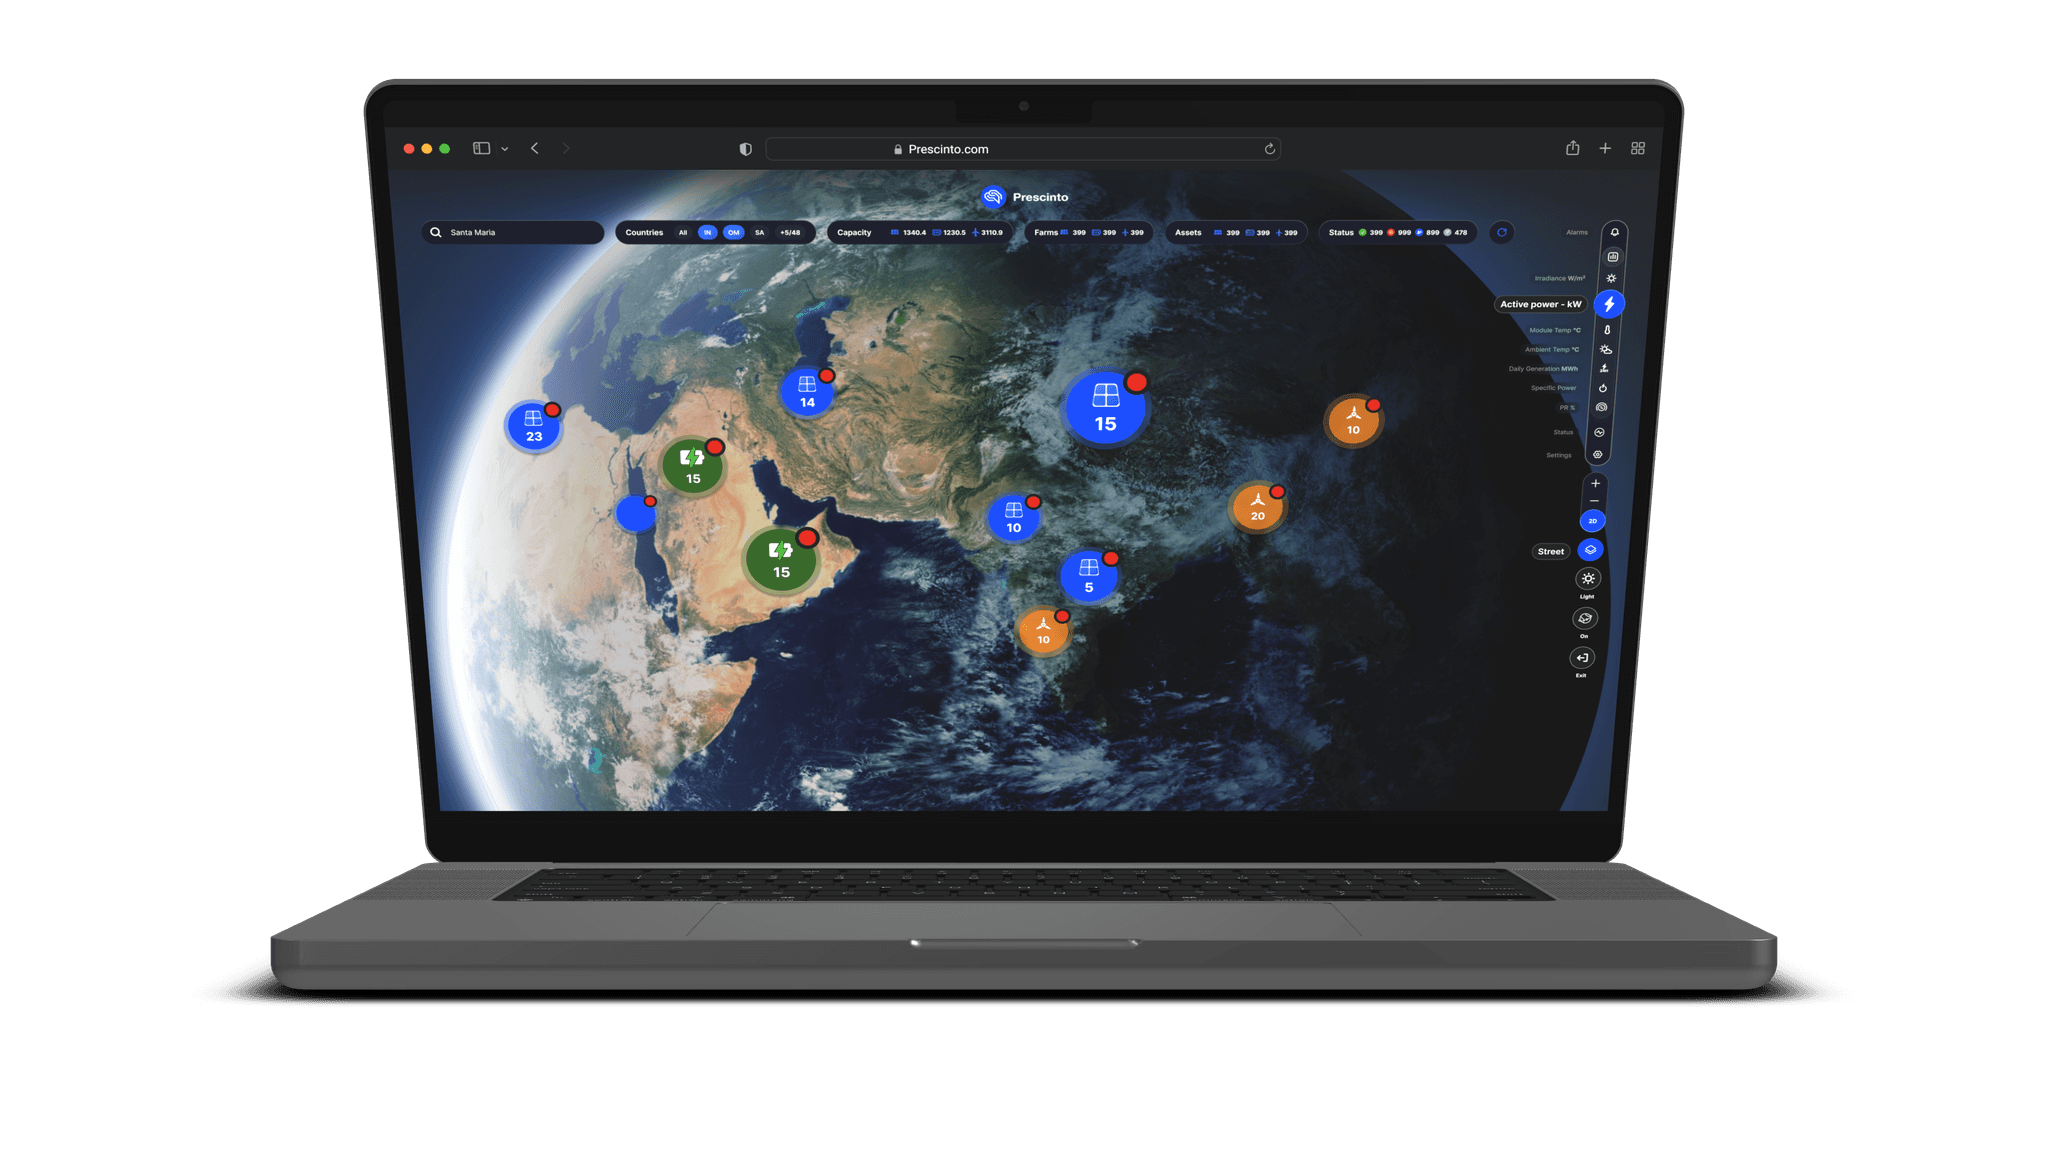
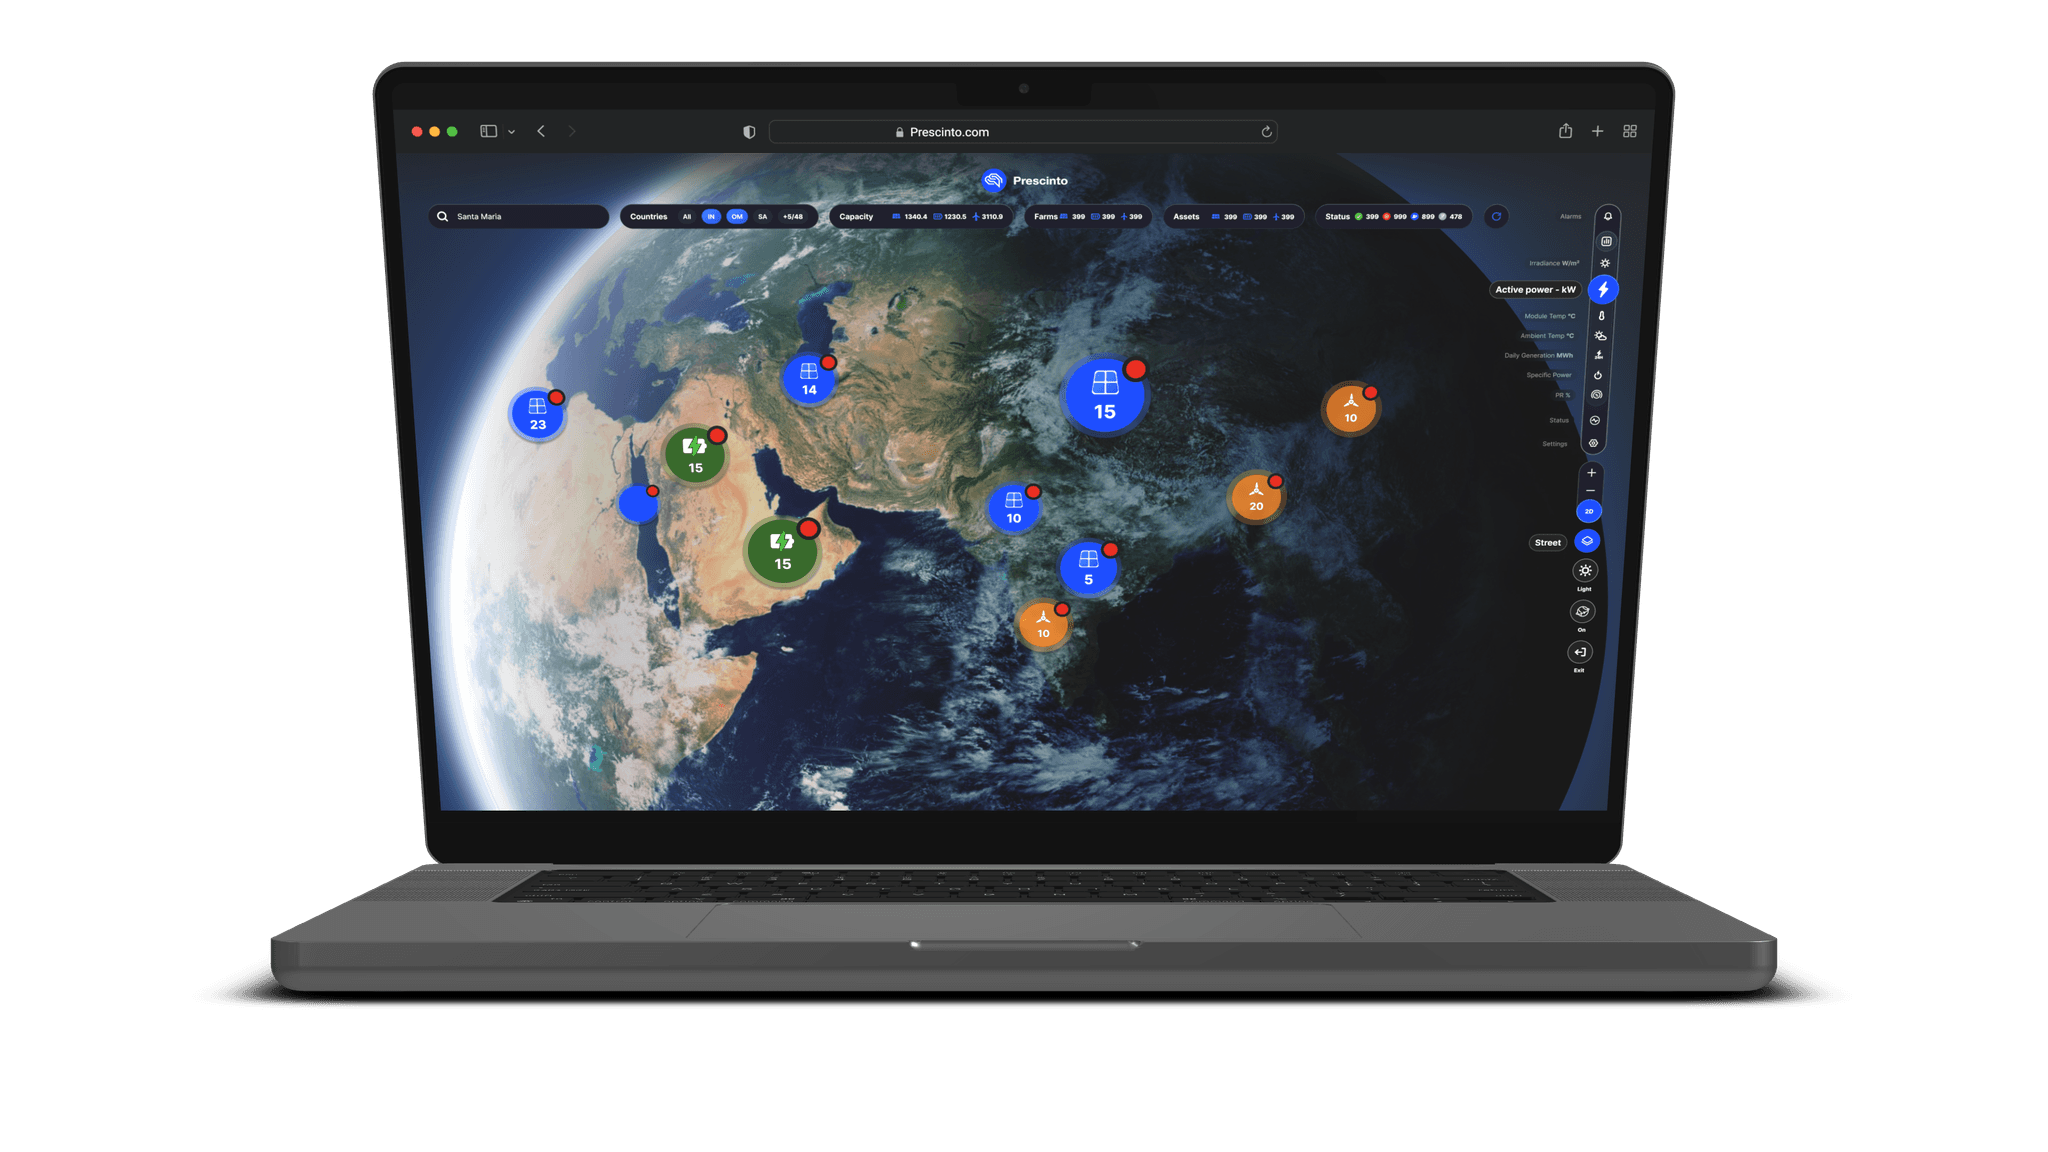
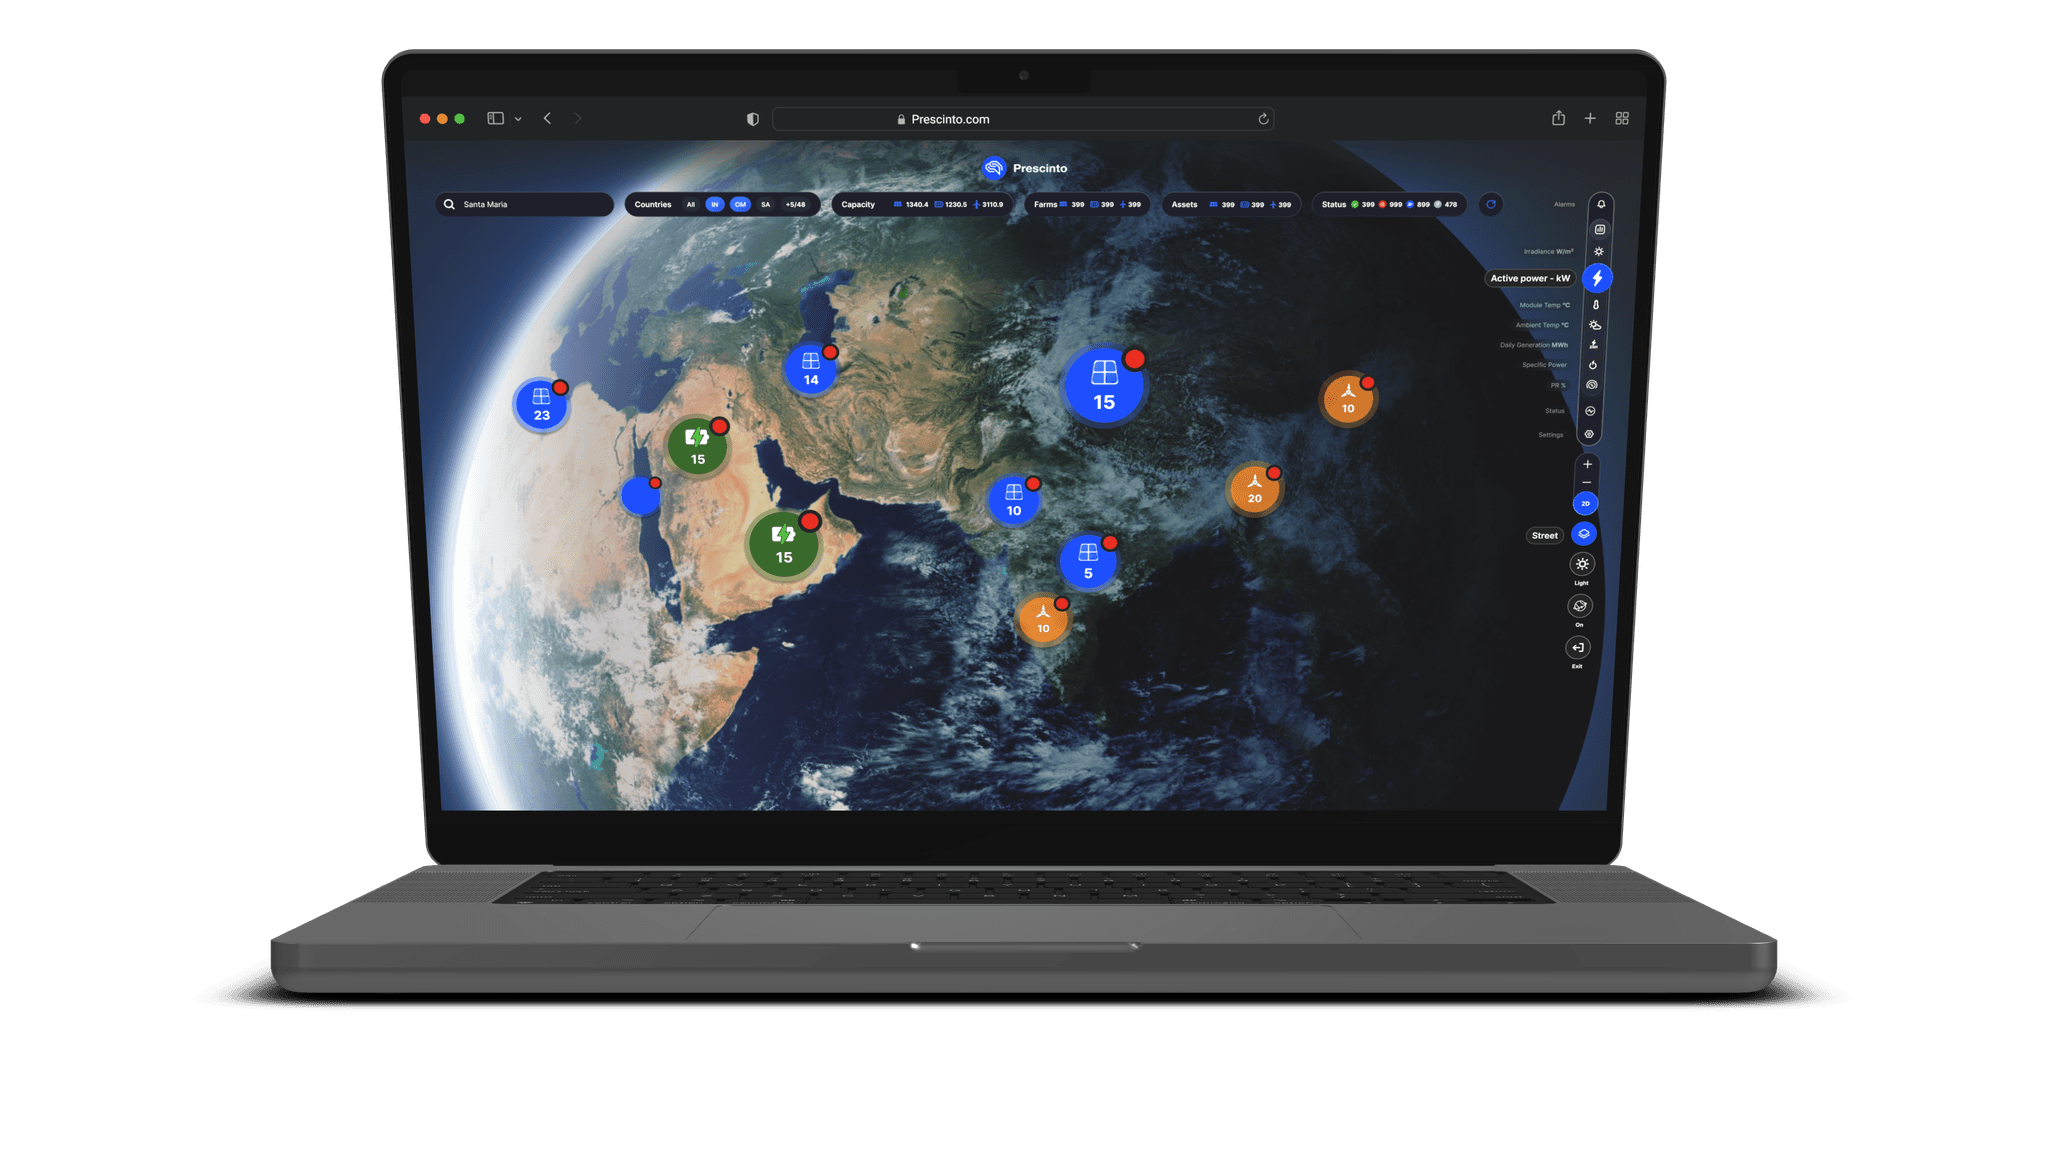
Translating Strategy into Design
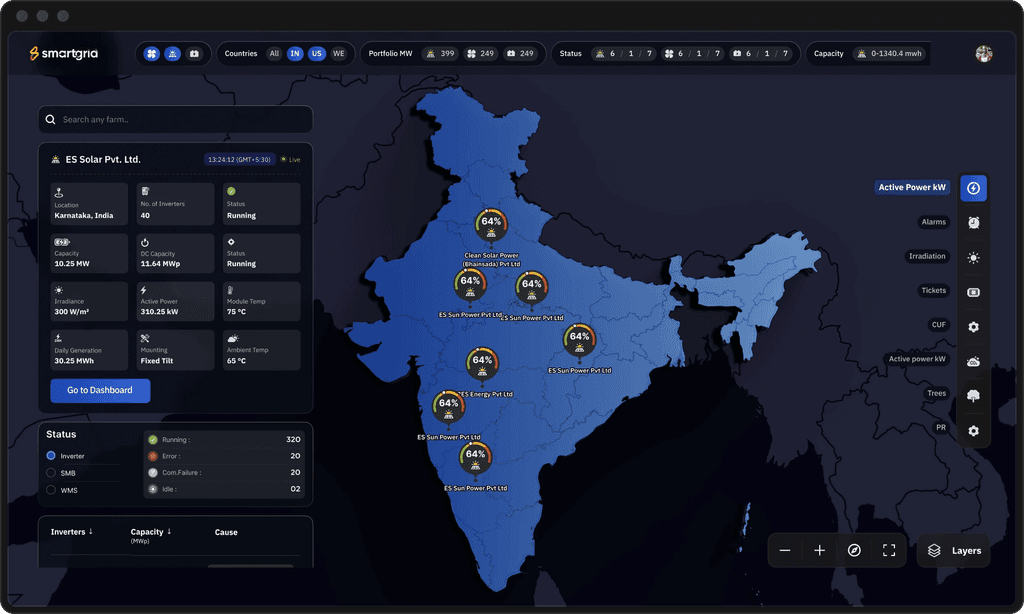
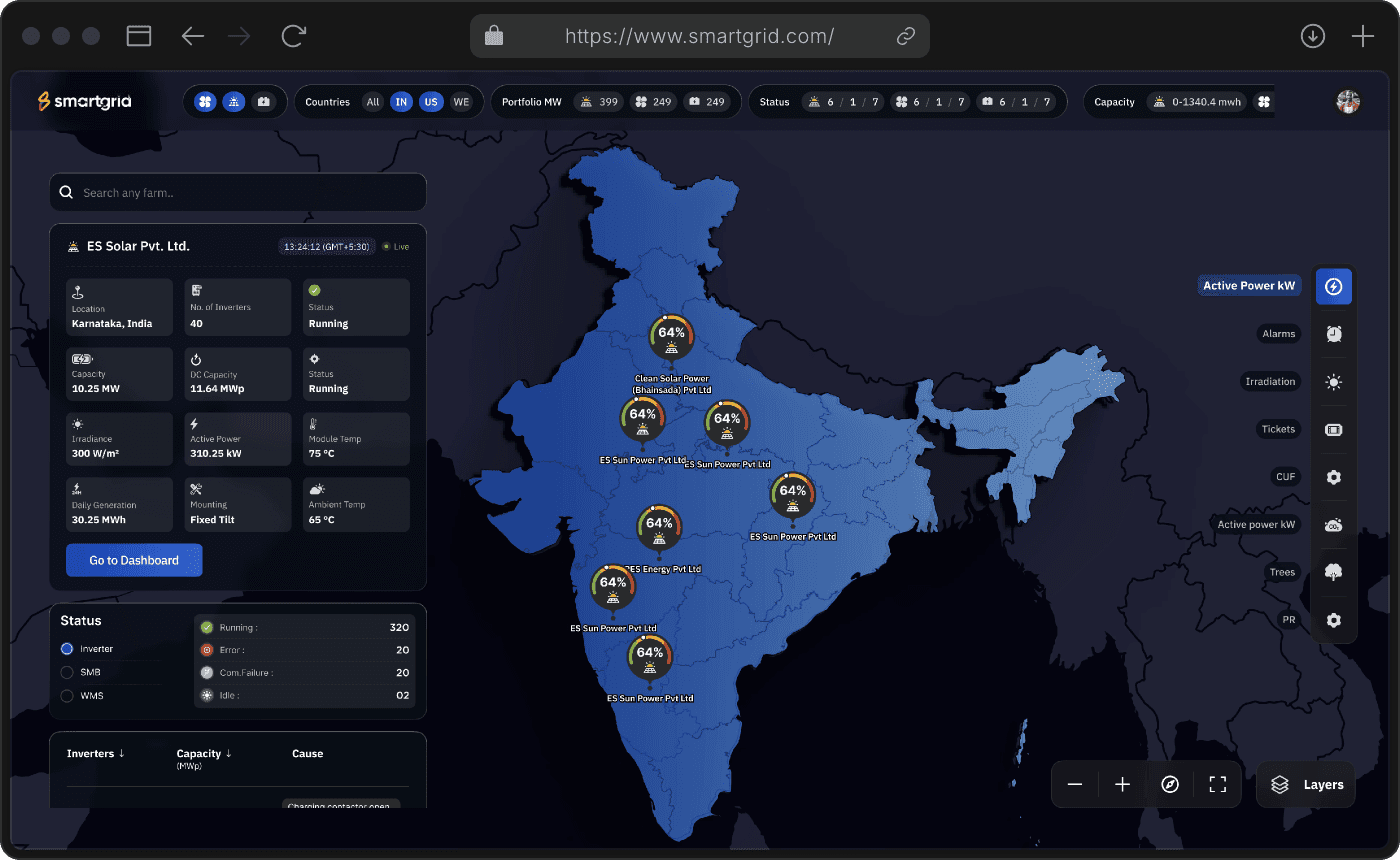
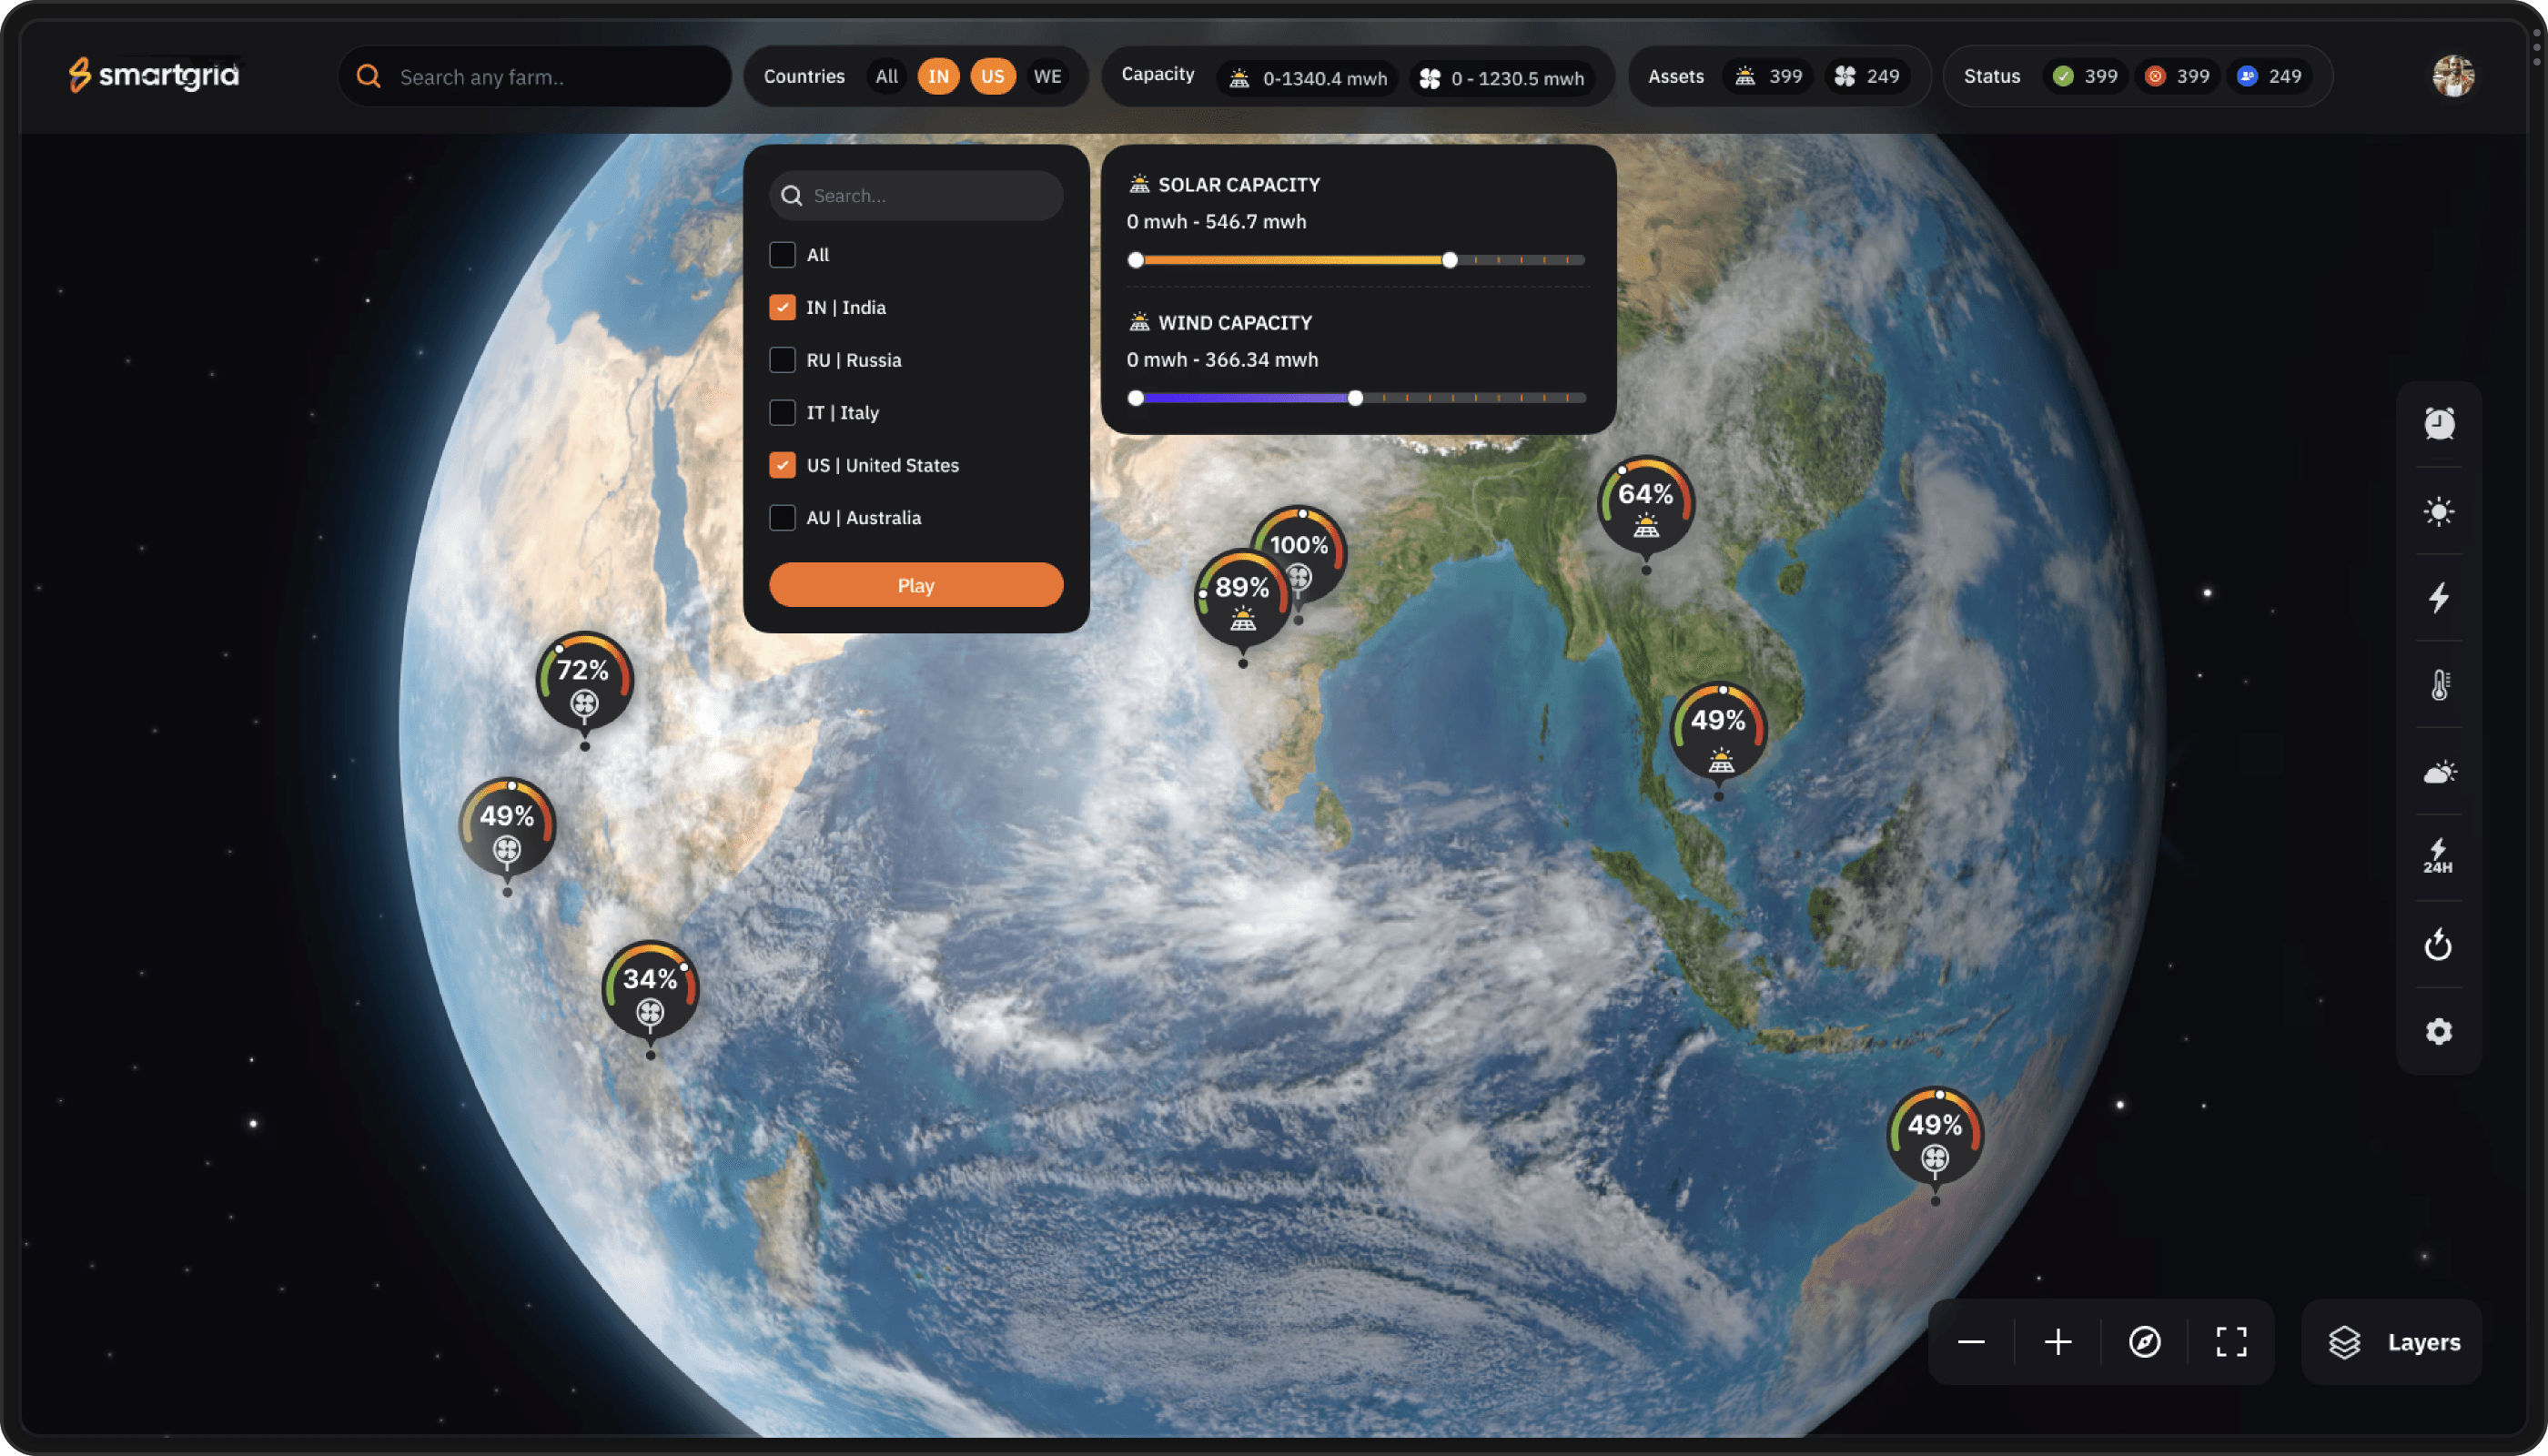
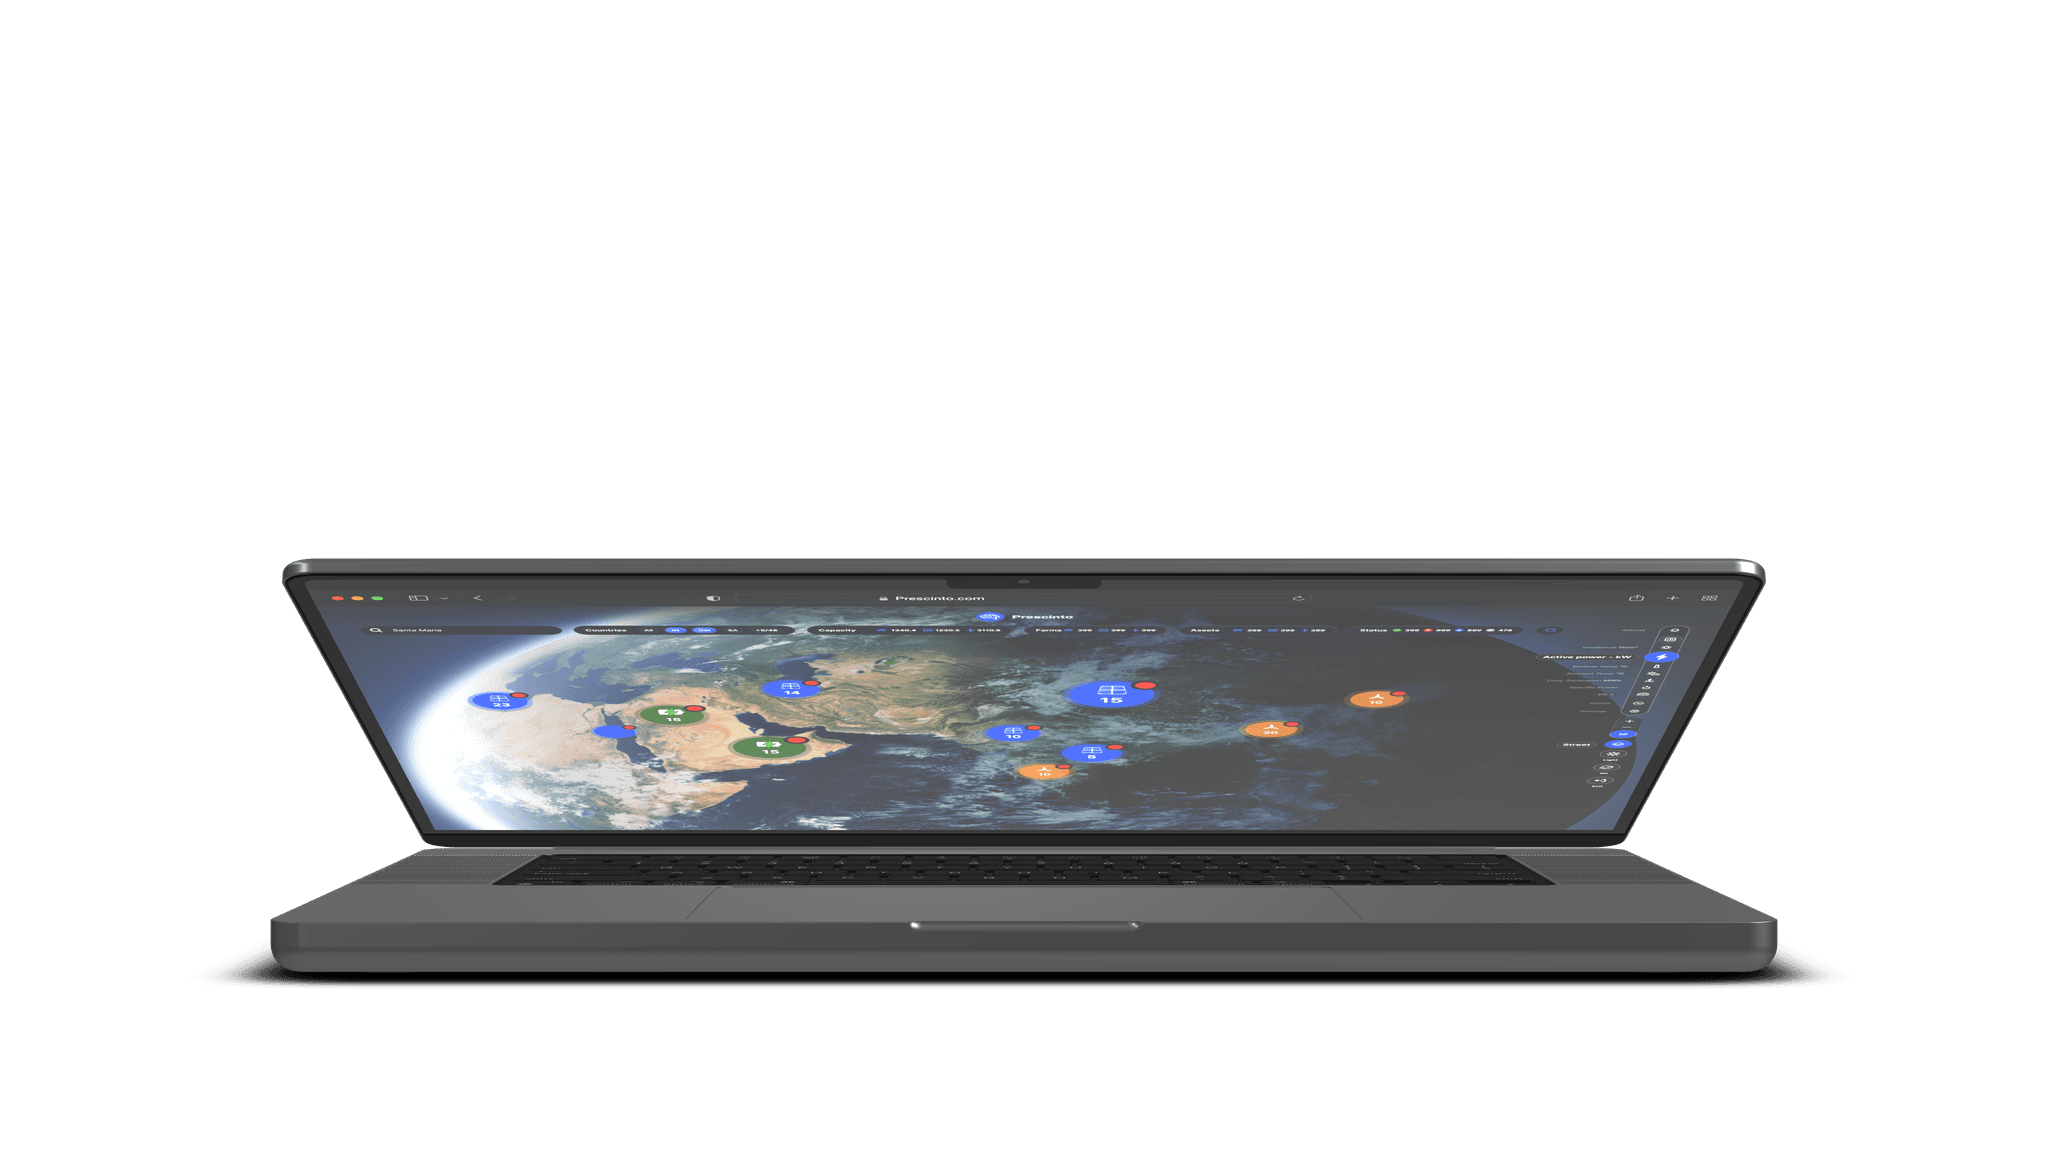
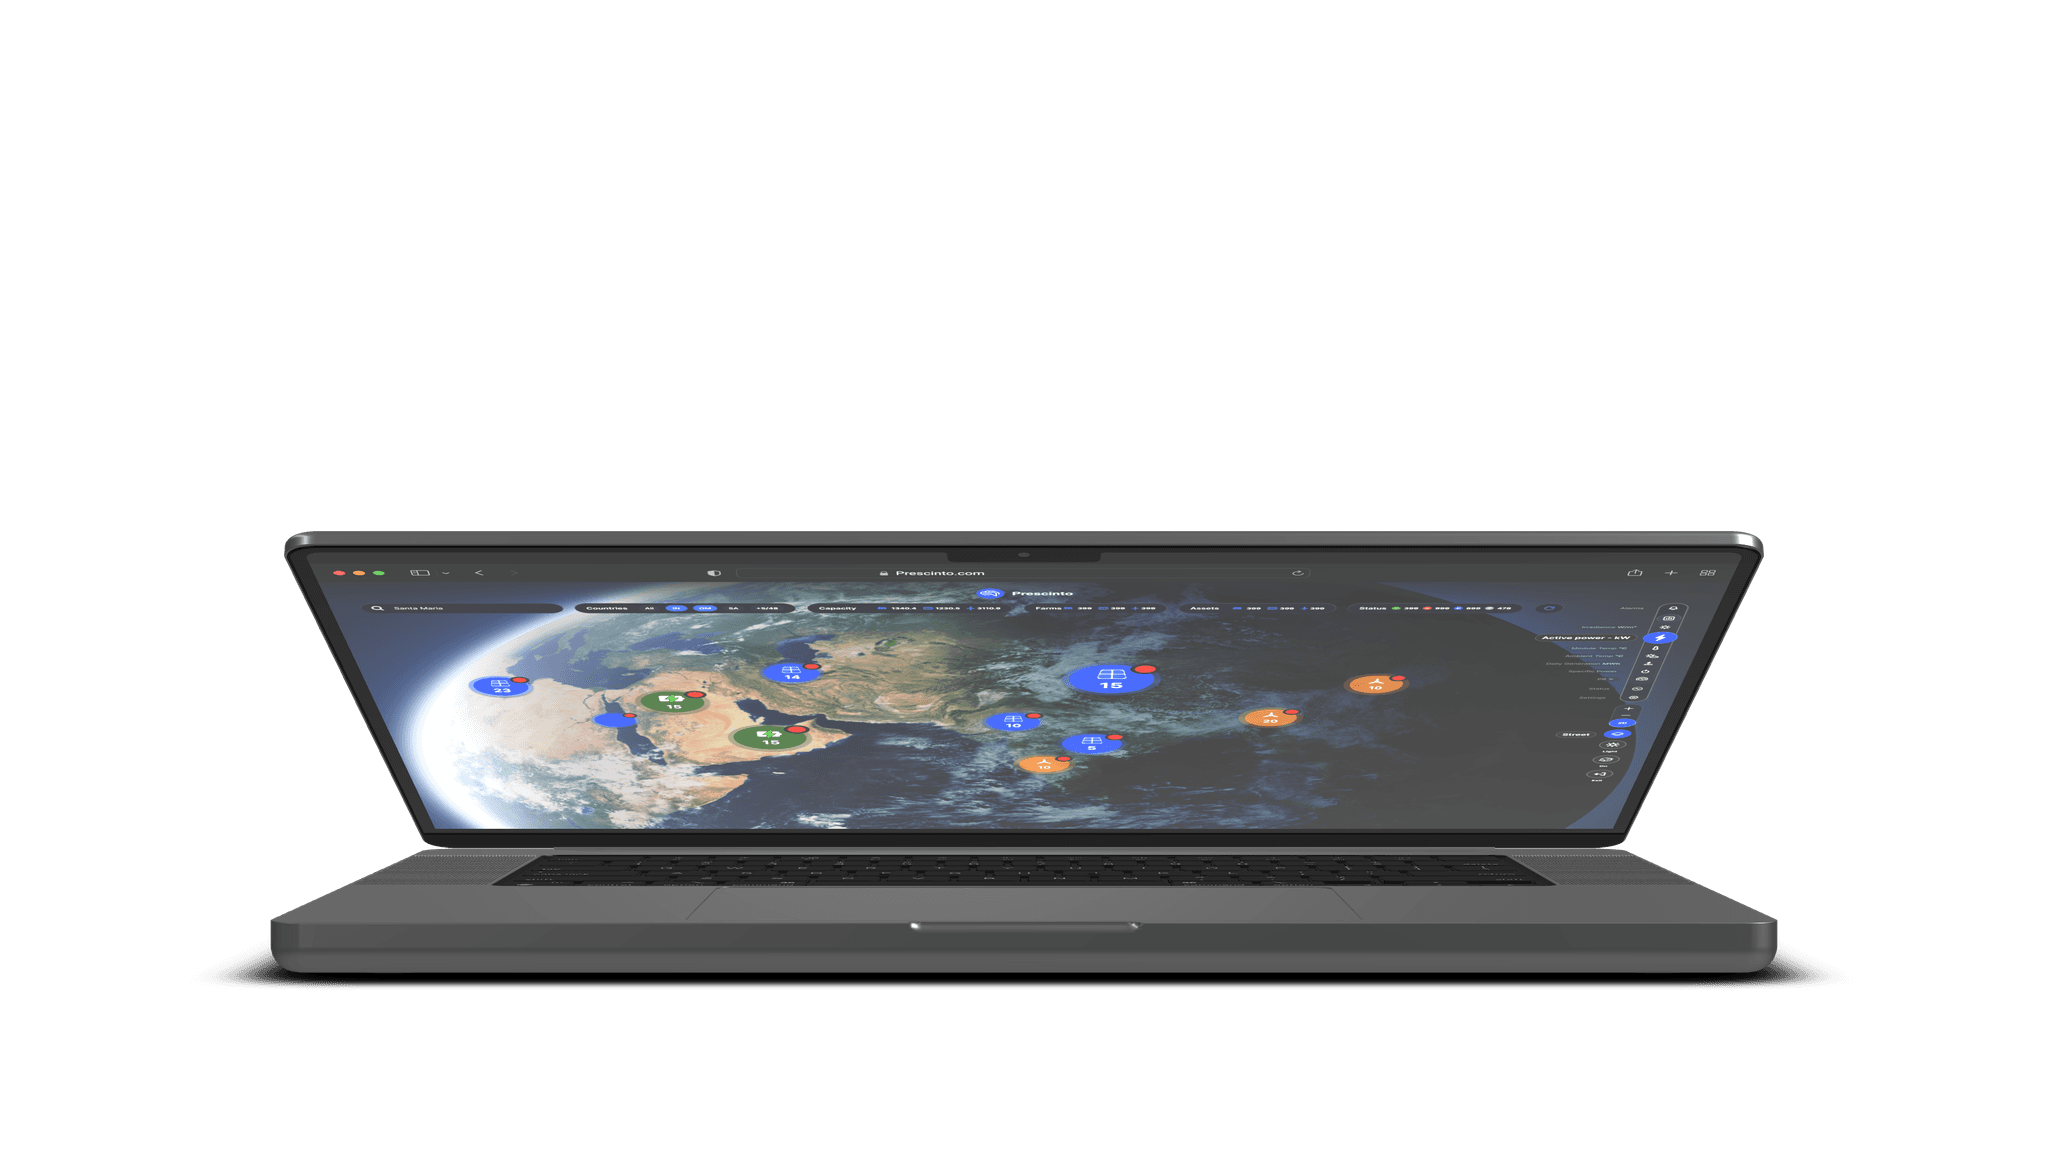
Monitor and analyze real-time data from solar and wind farms with a customizable alert system. This map view keeps you consistently informed, enabling proactive decisions for improved maintenance and prevention strategies.


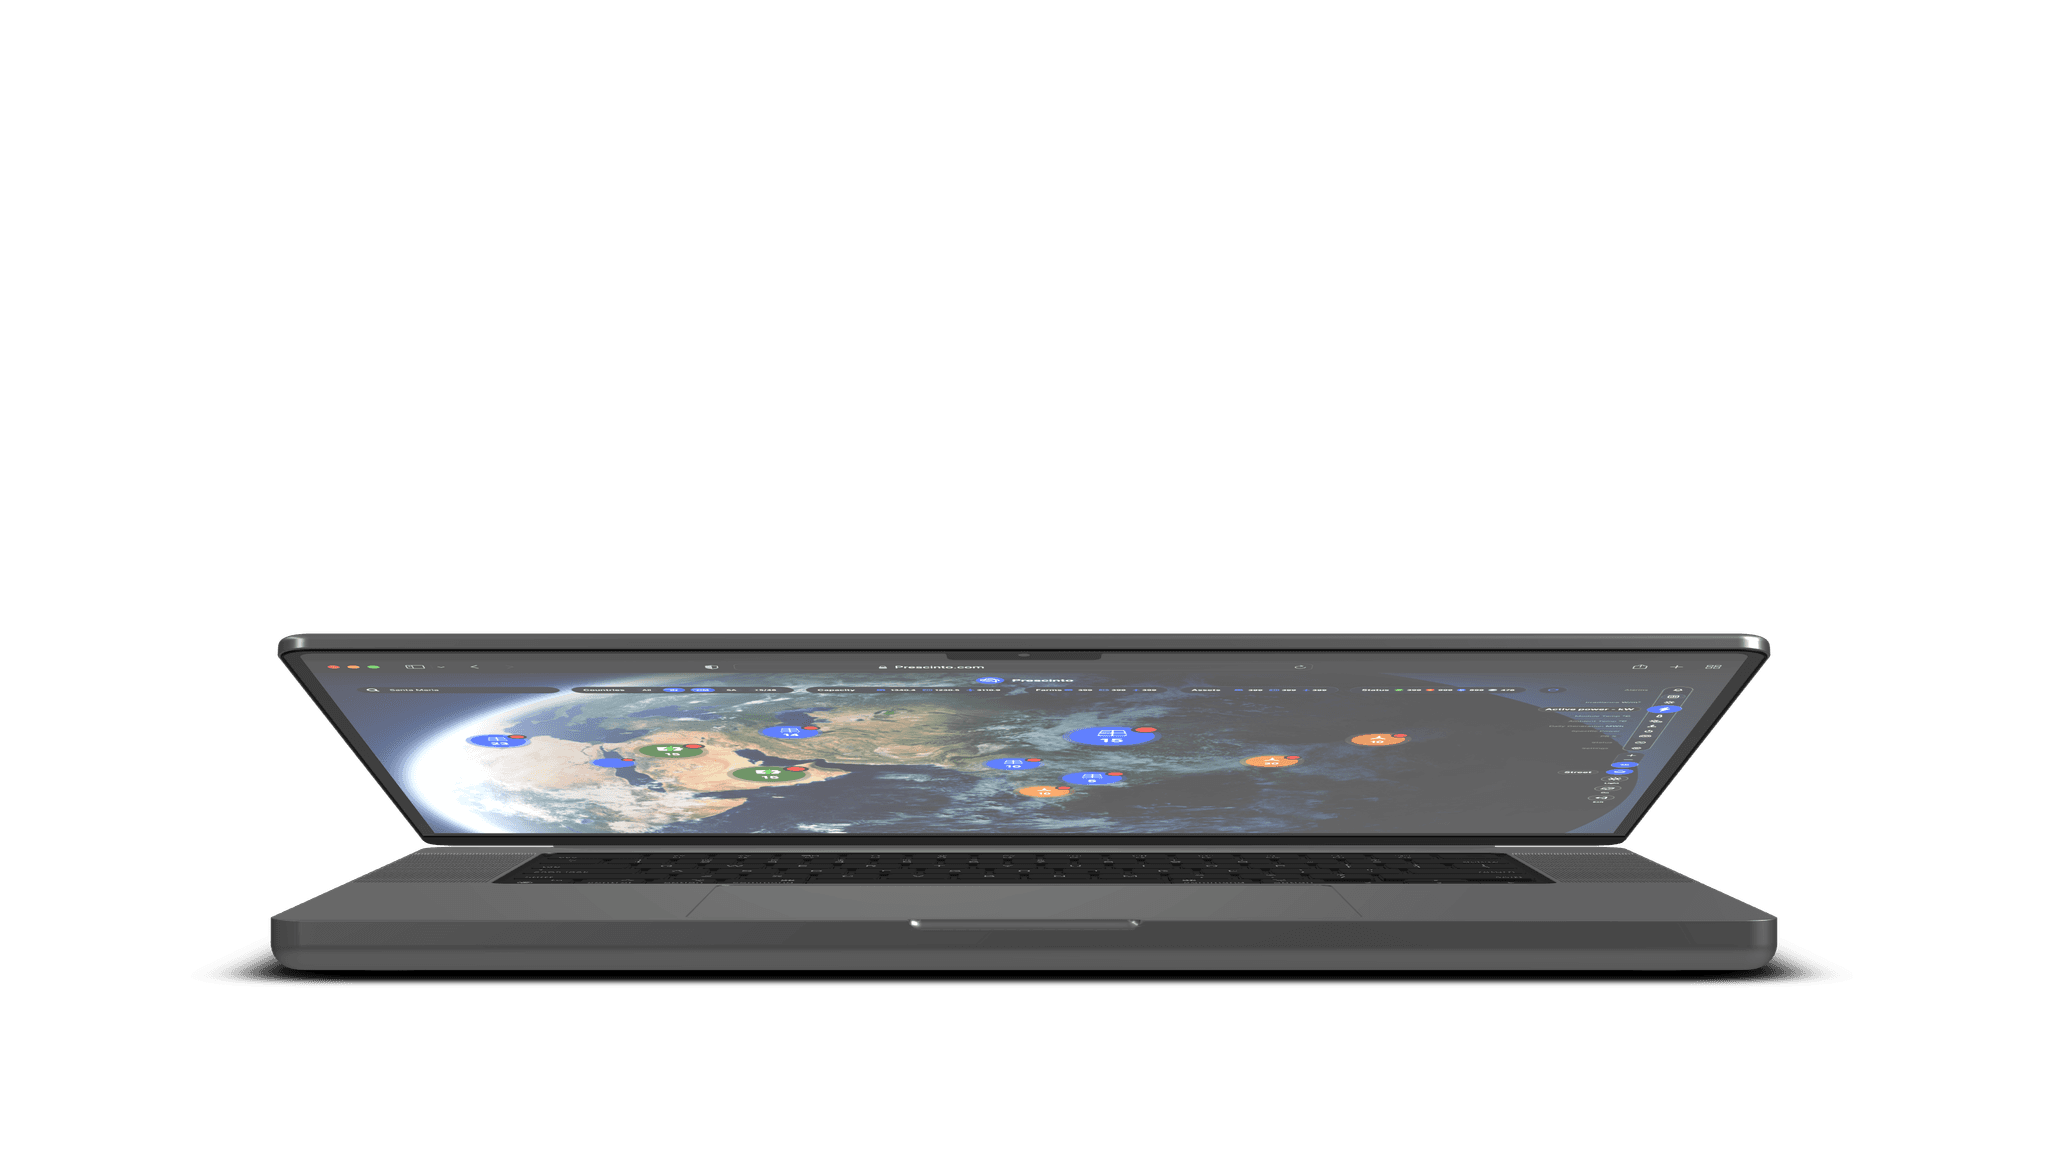
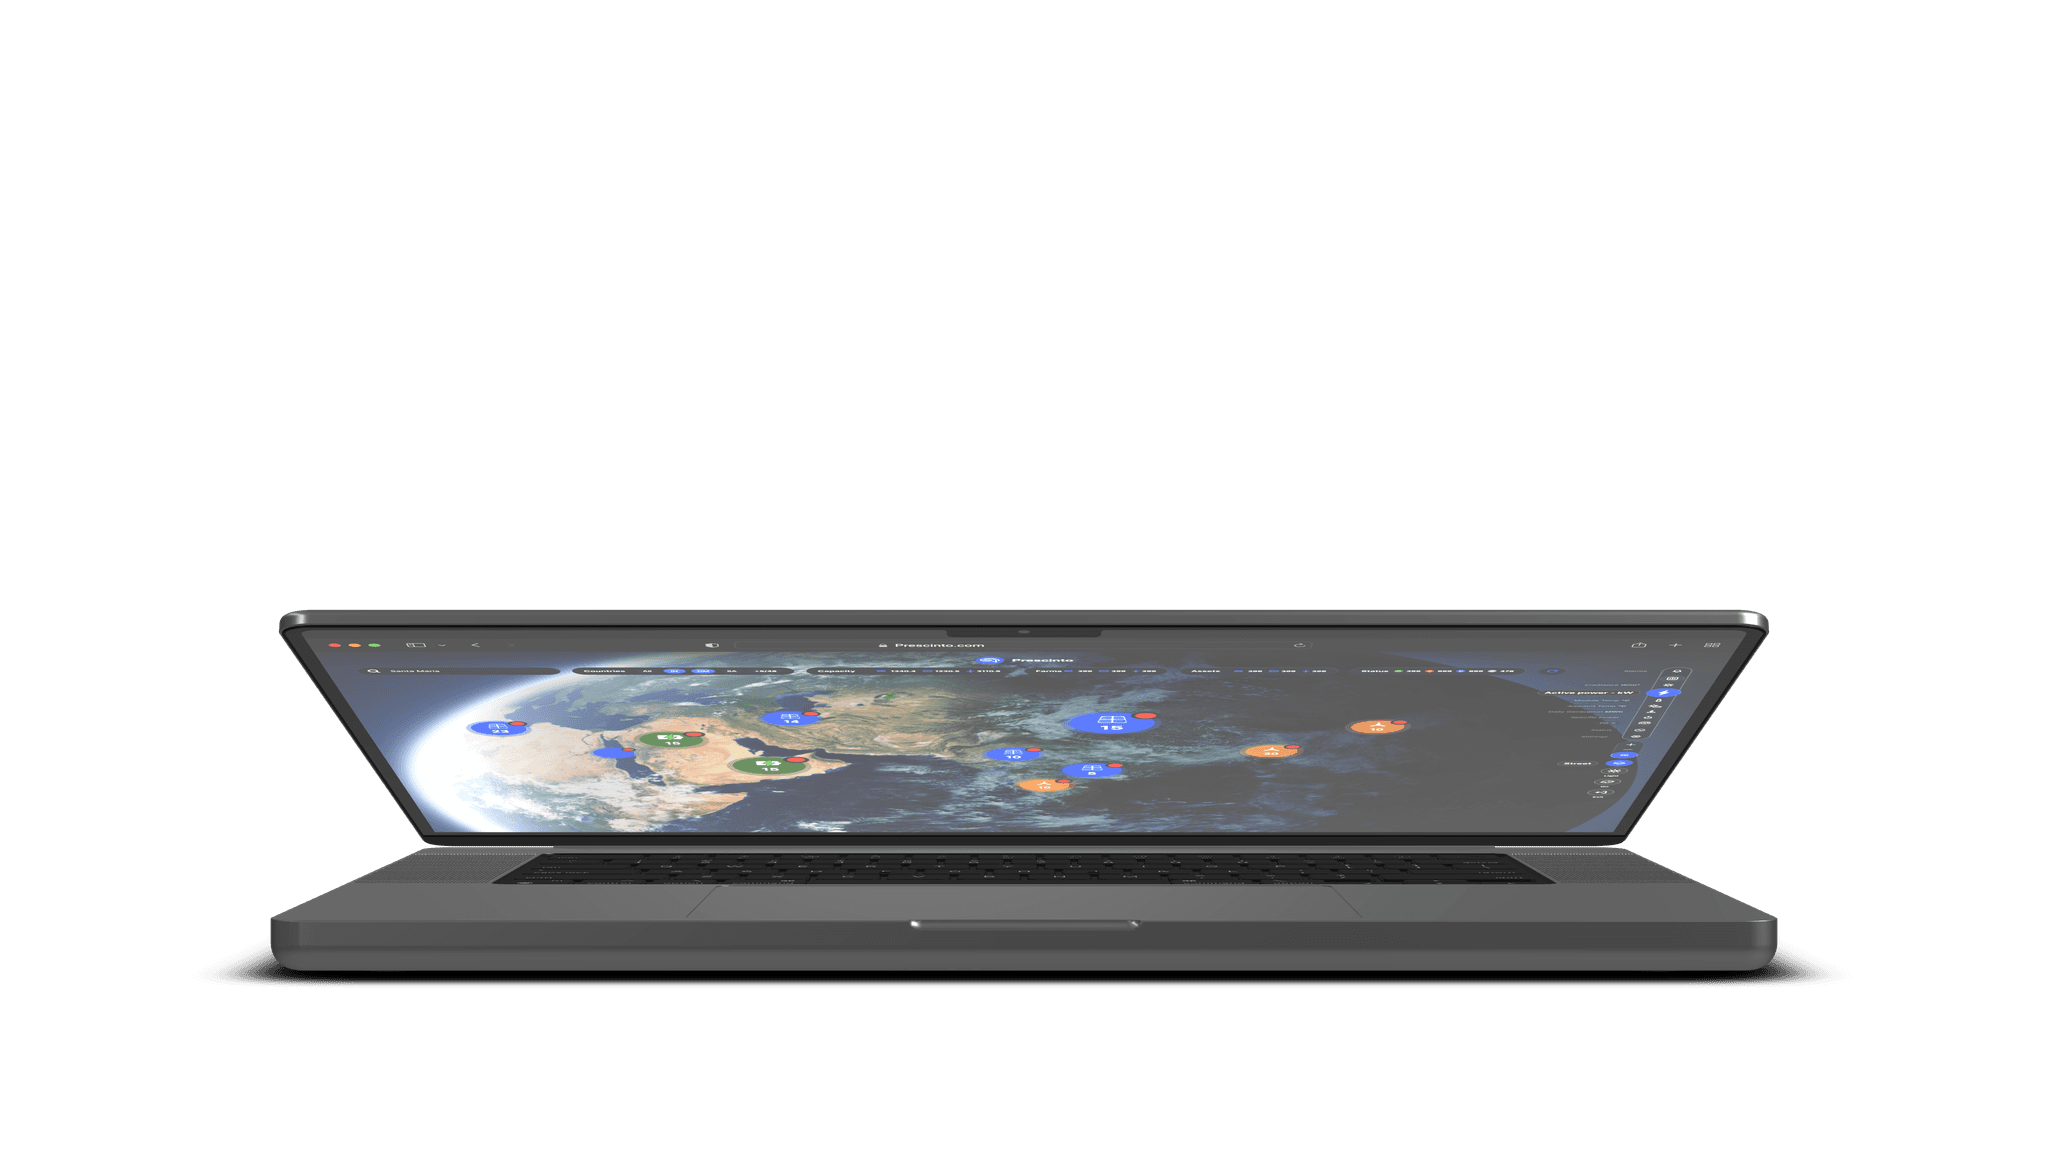
My Prescinto Map View project not only attracted top companies like Param and Smartgrid but also played a pivotal role in Prescinto’s growth. This innovation caught the attention of IBM, leading to their acquisition of Prescinto—a testament to the value and influence of strategic UI/UX design in shaping industry success.